
Budgets are set by addition and rescued by subtraction. The market has already decided how it allocates capital — to fewer companies, on more evidence, over longer horizons. The open question is whether corporate innovation budgets will be rebuilt on the same logic.
This is the final article of three published across the Q4 2026 planning window. Part one established the market you are budgeting into and where to play. Part two covered how to access capability. This instalment covers the evidence gate, what to stop, how to measure what remains — and what the whole series adds up to.
KEY TAKEAWAYS
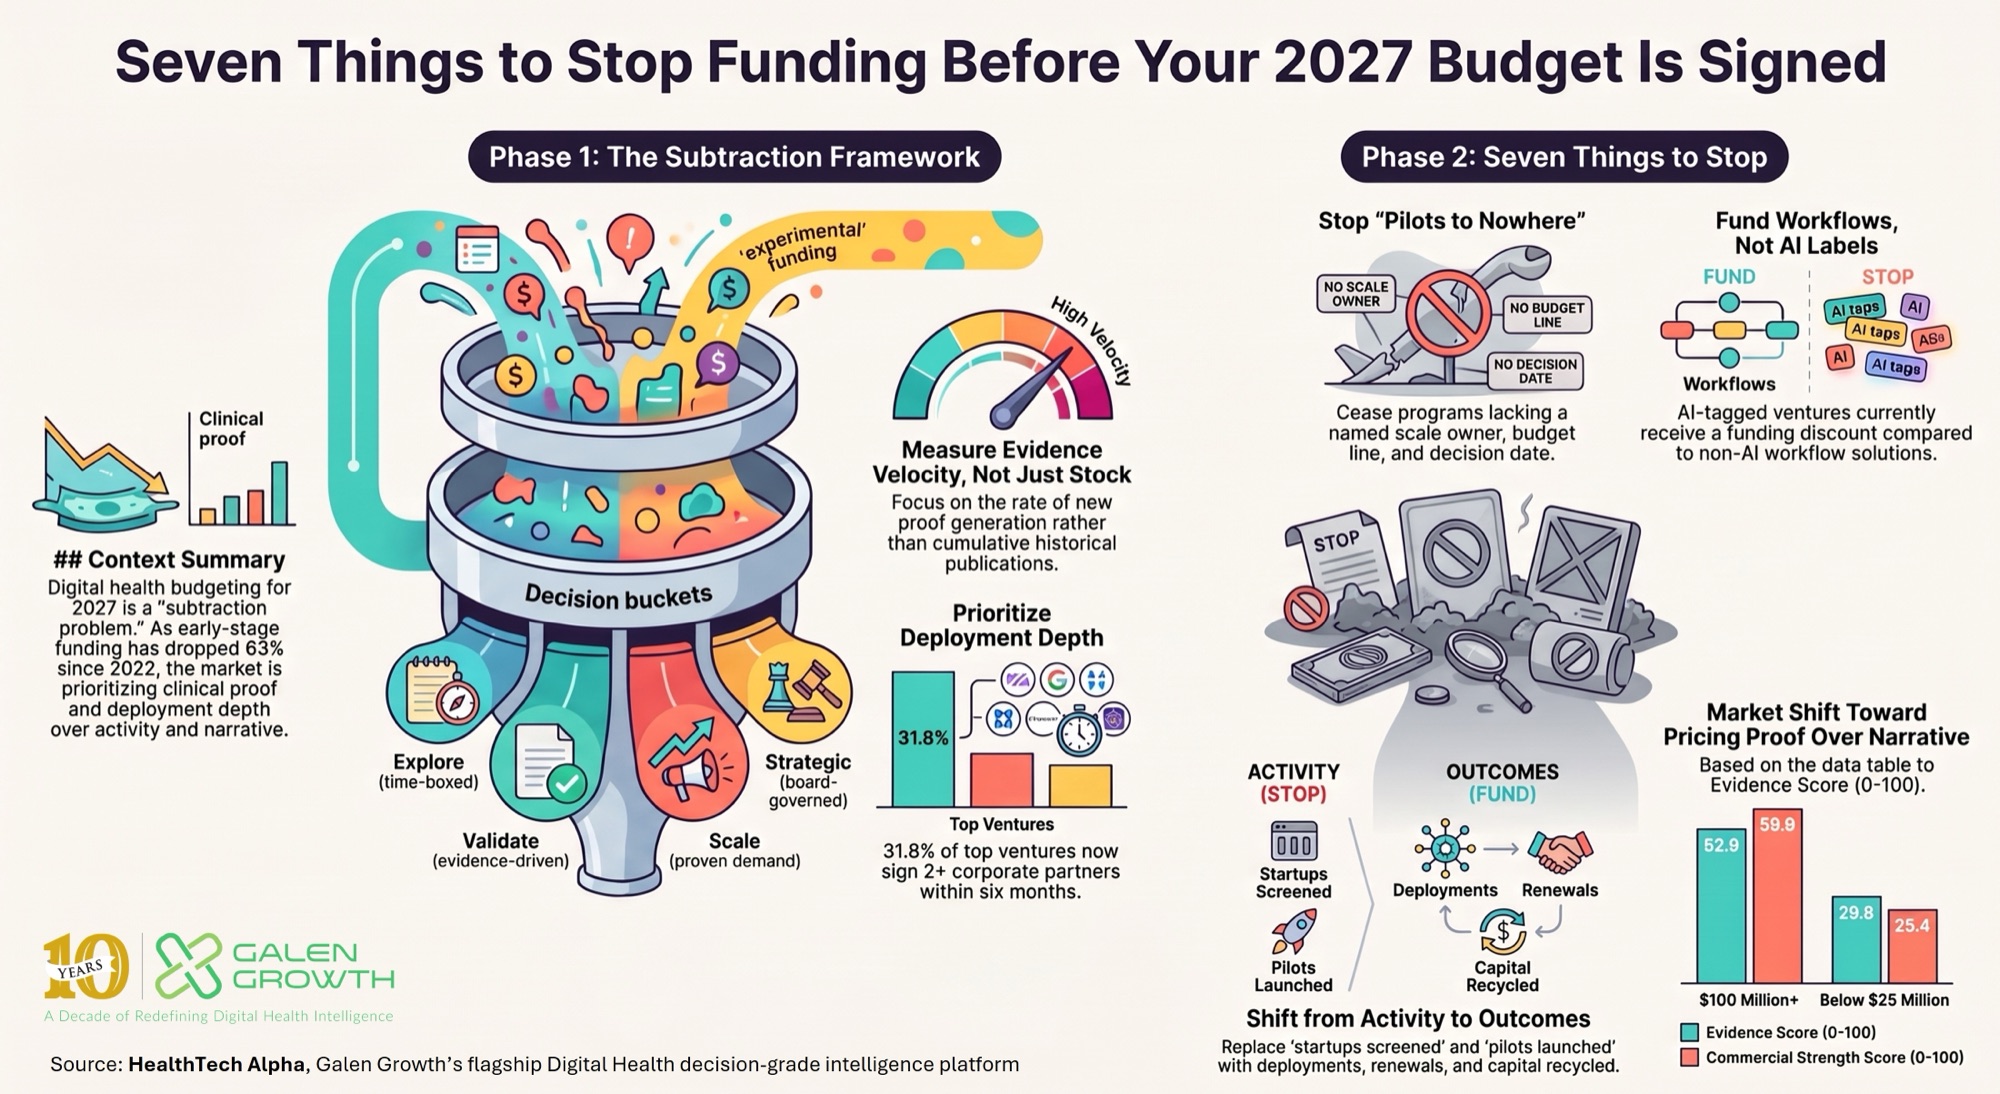
- The market is pricing proof, not narrative. Ventures raising $100 million or more in H1 2026 averaged an Evidence Score of 52.9 and a Money Score of 59.9, against 29.6 and 25.4 for ventures raising under $25 million. Every quality dimension rises monotonically with round size.
- Deployment depth is real and measurable. 31.8% of ventures partnering with corporates in H1 2026 signed two or more distinct corporate partners inside the same half-year, up from 24.9% in H1 2021 — meaning the companies in your Scale bucket are being deployed by several of your peers at once.
- Seven things are worth stopping before you allocate anything new, headed by pilots without a defined scale pathway, AI funded as a technology category rather than a workflow, and partnership counts used as an innovation metric.
- Distinguish evidence velocity from evidence stock. Average Evidence Score rises monotonically with company age — 8.3 for ventures founded since 2023 against 28.6 for those founded before 2005 — so any cumulative evidence measure structurally rewards incumbency over quality.
- Today’s discipline is tomorrow’s pipeline gap. Early-stage rounds fell 63% between H1 2022 and H1 2026, from 794 to 290. On a decade-long path to exit, that contraction sets the size of the opportunity set available to every corporate development team at the end of this decade.
Parts one and two of this series settled where to play and how to access capability. Both are addition problems. This instalment is a subtraction problem, and it is the harder of the two: in a concentrated market the cost of running a weak programme is no longer just its budget. It is the partnership slot, the integration capacity and the clinical governance attention that a scalable programme needed.
The analysis in this series is drawn from Galen Growth’s 2027 budget planning guide. The Digital Health Budget Planner brings it together in one place: an interactive tool for working through the four decisions against your own allocation, and the full planning manual behind the three articles.
The evidence gate: what the market is actually paying for
If capital is concentrating, it is worth knowing precisely what it is concentrating behind. Segmenting every venture that raised in H1 2026 by round size gives an unusually clean answer.
Venture Quality Scores by H1 2026 Round Size Band
| Round size band | Ventures | Evidence | Partnership | Alpha (maturity) | Money |
|---|---|---|---|---|---|
| $100 million and above | 35 | 52.9 | 65.0 | 73.0 | 59.9 |
| $25 million–$100 million | 94 | 36.6 | 51.8 | 63.7 | 42.1 |
| Below $25 million | 363 | 29.6 | 40.1 | 54.0 | 25.4 |
| Undisclosed | 68 | 30.1 | 49.4 | 56.0 | 29.8 |
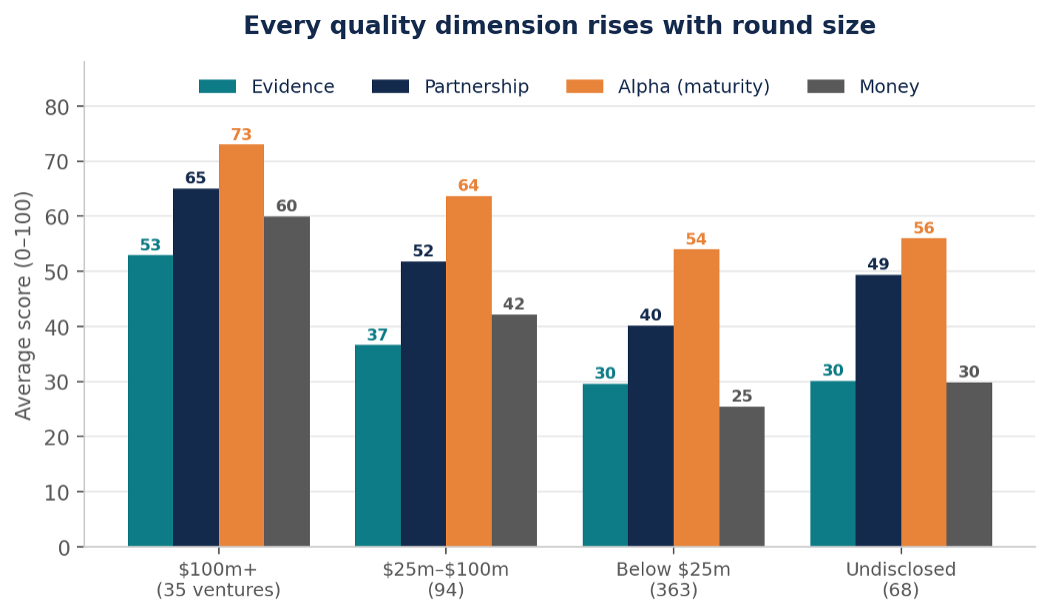
Source: HealthTech Alpha by Galen Growth, September 2026. Every quality dimension rises with round size, and the gap is widest on commercial strength — the market is pricing proof, not narrative.
Ventures raising $100 million or more scored 79% higher on Evidence and 62% higher on Partnership activity than those raising under $25 million. The gap on Money Score — 59.9 against 25.4 — is wider still. These are not companies that raised large rounds and subsequently became credible. They were already the most evidenced and most adopted companies in the market when they raised.
For an innovation leader, that reframes the diligence conversation rather than confirming it. If your evaluation of a venture would produce a materially different verdict from the one the capital markets have already reached, you need to be able to say why. The most common legitimate reason is timing: you may be evaluating a company two years before the evidence base that will eventually attract institutional capital exists. That is a defensible bet, and it is precisely what a partnership is for. It is not a defensible basis for an acquisition.
Turn the list of pilots into a portfolio
Most innovation functions do not have a portfolio. They have a list of pilots of varying age, unclear ownership and no exit criteria.
A workable structure has four buckets and one rule per bucket. Explore covers early, uncertain bets whose only job is to produce a decision — fund them small and time-box them. Validate covers programmes generating clinical or commercial evidence, where the rule is that the evidence question must be defined before the money is released. Scale covers proven capabilities with demonstrated enterprise demand, where the constraint is integration capacity rather than conviction. Strategic covers the small number of capabilities that could reshape the organisation, which should be governed at board level and funded on a multi-year basis rather than annually.
The allocation across those four is yours to calculate, not ours to prescribe. The discipline is in the arithmetic: if you cannot state what percentage of your innovation budget sits in each bucket, you do not yet have a portfolio. Two market signals should inform the balance.
The first is that the scaling of enterprise relationships is real. 31.8% of ventures partnering with corporates in H1 2026 signed two or more distinct corporate partners inside the same half-year, up from 24.9% in H1 2021 — a structural climb sustained across five periods rather than noise. The companies in your Scale bucket are being deployed by several of your peers simultaneously, which changes both your negotiating position and your integration urgency.
Share of Partnering Ventures Signing Two or More Corporate Partners, H1 2021–2026
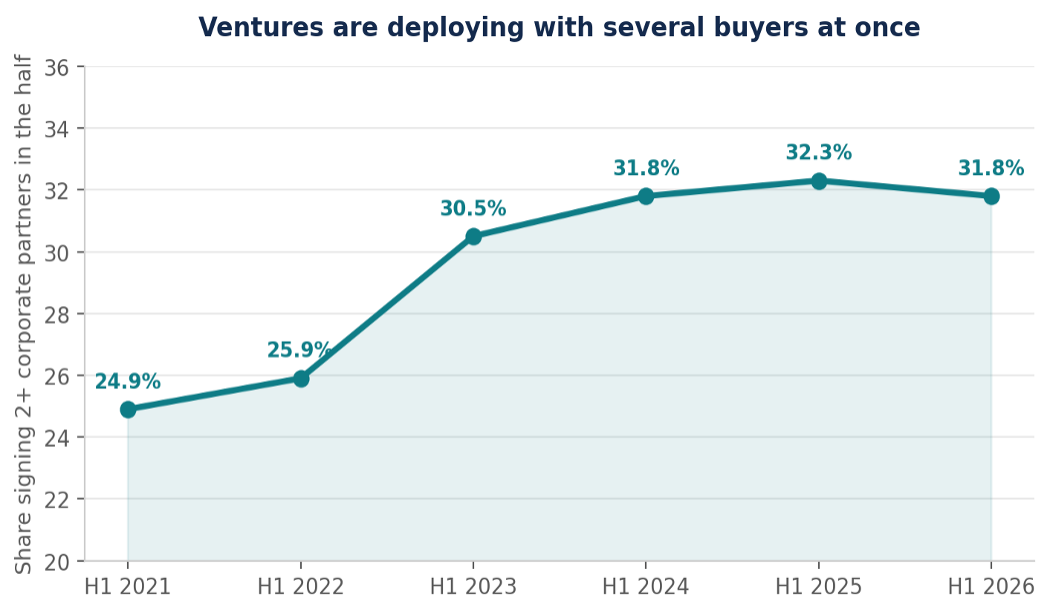
Source: HealthTech Alpha by Galen Growth, September 2026. A venture is counted as multi-partner if it announced two or more distinct corporate partnerships within the same H1 window. The H1 2026 figure is preliminary and expected to revise upward as later-reported deals are backfilled.
The second is that the venture population feeding your Explore bucket is thinning fast: 290 early-stage rounds in H1 2026 against 794 four years ago. Sourcing breadth at the front of the funnel is no longer available to you on the terms it was in 2022, which argues for fewer, better-specified Explore bets rather than a wider net.
Measurement should change with the structure
Counting pilots, startups met and events attended measures activity. In an industrial market it measures the wrong thing, because activity was the currency of a market that paid for experimentation and this one does not.
Five measures describe outcomes rather than effort: the proportion of the portfolio aligned to stated strategic priorities; deployments and renewals rather than launches; evidence and regulatory milestones achieved; time from pilot to scale decision; and — the metric almost nobody tracks — capital recycled out of terminated programmes into funded ones. The last is the one that converts a list of things to stop from a document into a mechanism, because it makes stopping something visibly fund starting something else.
The seven things to stop funding
Seven things are worth stopping before you allocate a pound or a dollar to anything new.
- Stop running pilots without a defined scale pathway. If nobody can name the budget line, the integration owner and the decision date that would follow a successful pilot, the pilot is a purchase of information you will not act on.
- Stop funding AI because your competitors are funding AI. The label carries no funding premium and, on the H1 2026 evidence, a modest discount — an average disclosed round of $30.9 million against $36.7 million for everything else. Fund the workflow, not the technology category.
- Stop treating partnership counts as an innovation metric. Signing partnerships is easy and getting easier: 1,597 were disclosed in a single half-year. Depth — second and third partnerships, renewals, deployment scope — is the signal.
- Stop building capabilities you could buy faster. With 83 acquisitions in H1 2026 and mature targets available at every scale, an internal build that takes three years to reach parity is a decision to arrive late.
- Stop assuming technical novelty creates defensibility. The categories being acquired most often are the least novel: workflow, documentation, scheduling, diagnostics infrastructure. Health Management Solutions alone accounted for 22 of 83 H1 2026 acquisitions.
- Stop evaluating ventures without mapping their likely acquirers. A partner bought by your competitor mid-deployment is a strategic problem, not a commercial one. Ask who buys this company, and what happens to you if they do.
- Stop measuring the innovation function by activity. Pilots launched, startups screened and events attended describe effort. Deployments, renewals, evidence generated and capital recycled describe outcomes.
The uncomfortable part: today’s discipline is tomorrow’s pipeline gap
Everything above describes a healthier market than the one that existed in 2021. It also describes a risk that no individual organisation has an incentive to solve.
Early-stage funding rounds fell from 794 in H1 2022 to 290 in H1 2026, a 63% contraction steeper than the decline in the market as a whole. The companies that will be acquisition-ready in 2032 are being founded and seeded now, and there are far fewer of them. If the average path from incorporation to acquisition really is 10.7 years and lengthening, then the discipline being applied in 2026 sets the size of the opportunity set available to every corporate development team at the end of the decade.
Early-Stage Digital Health Rounds, H1 2022–2026
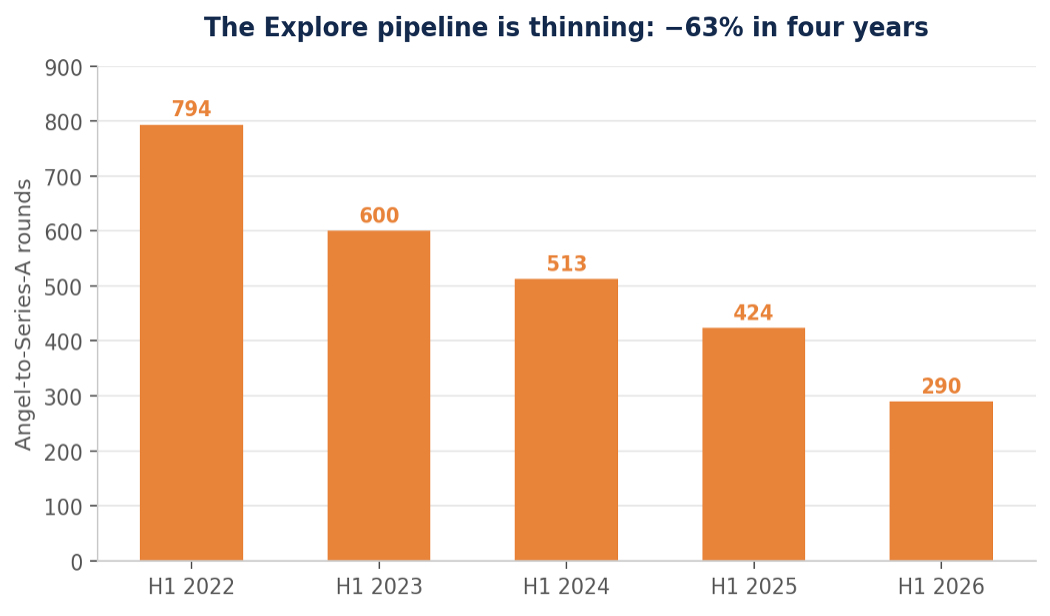
Source: HealthTech Alpha by Galen Growth, September 2026. Covers angel, seed, pre-A and Series A rounds in H1 (1 January–30 June) of each year. The contraction at the front of the funnel is steeper than the 58% decline in total round count over the same period.
There is a second-order version of the same problem inside the evidence data, and it is the single most useful correction an innovation team can make to its own diligence in 2027.
Selecting only for companies that already have evidence rewards incumbency and age over quality. A venture founded five years ago will out-score a better one founded two years ago on any cumulative measure of trials, approvals or publications, simply because it has had longer to accumulate them. The pattern is unambiguous across the tracked venture population: average Evidence Score rises monotonically with the age of the founding cohort, from 8.3 for ventures founded since 2023 to 28.6 for those founded before 2005.
Average Evidence Score by Founding Cohort
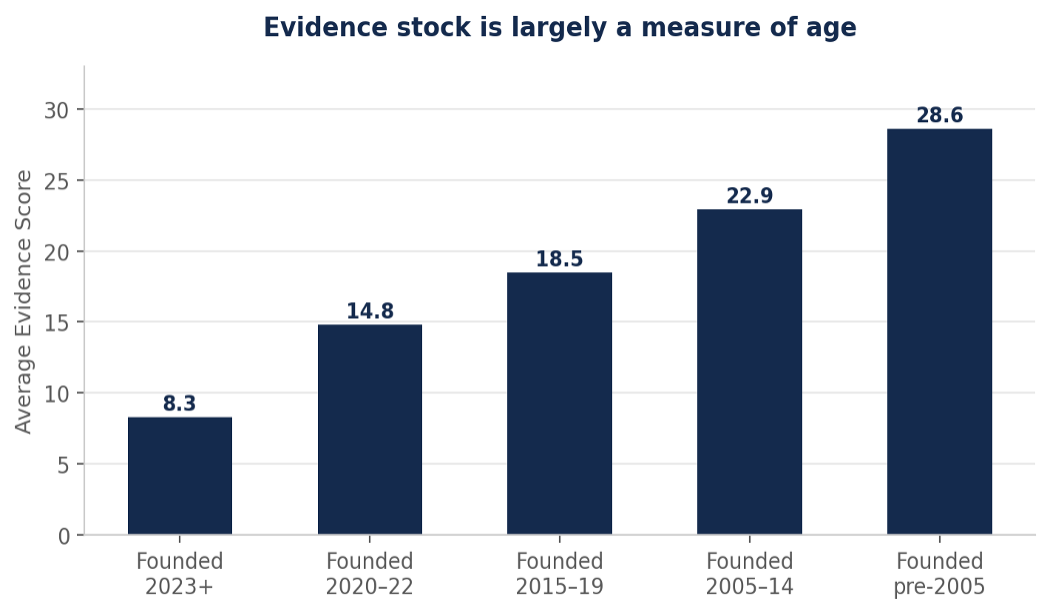
Source: HealthTech Alpha by Galen Growth, September 2026. Covers all tracked ventures with a recorded incorporation date and an Evidence Score. Evidence Score is cumulative, so the monotonic rise with cohort age is largely a measure of time in market rather than of quality.
The correction is to measure evidence velocity — is this venture generating proof faster than its cohort peers? — alongside evidence stock. Without it, an evidence-weighted diligence process systematically overweights incumbency and underweights genuine innovation, and does so invisibly.
The market-level version of the same tension is visible in what the sector is producing. Since 2021, new clinical trial starts by digital health ventures have fallen from 742 to 505 in 2025 — an index of 68 against a 2021 baseline of 100. Over the same window, peer-reviewed publication output rose from 12,489 to 23,611, an index of 189. The industry is not generating dramatically more primary clinical evidence. It is publishing, disclosing and formalising the evidence it already has more aggressively than before.
Digital Health Evidence Output, Indexed (2021 = 100)
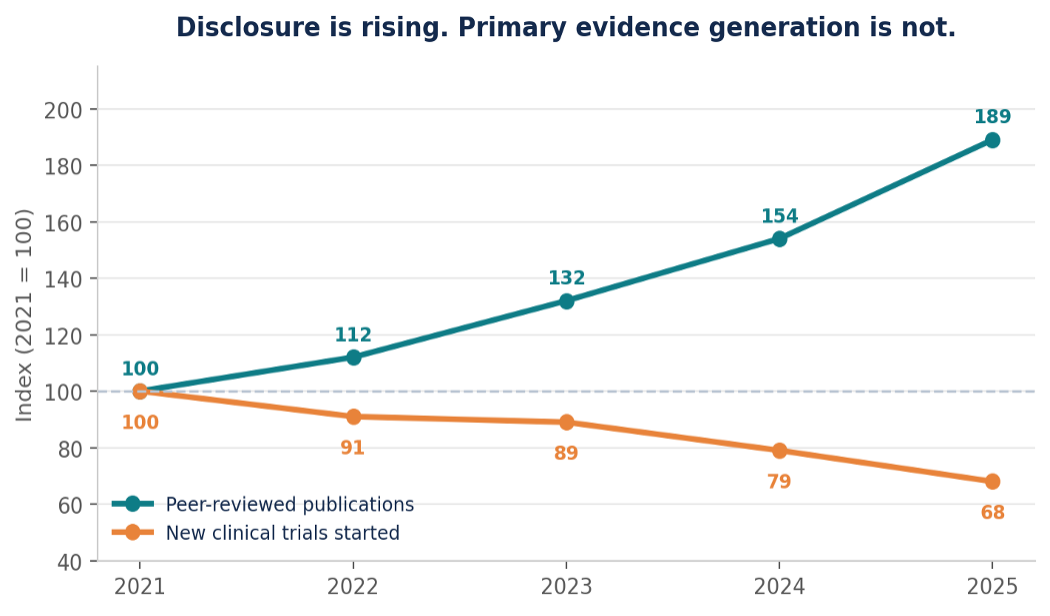
Source: HealthTech Alpha by Galen Growth, September 2026. Trials are counted by recorded start date and publications by published date; 2026 is excluded from both series because current-year records remain materially incomplete. Disclosure is outpacing generation.
Some of that is healthy. Real-world evidence studies, retrospective analyses and secondary publications extend the useful life of a single dataset at a fraction of the cost of a new randomised trial. But it also means the newest cohort of ventures is entering the market with a thinner primary evidence base than its predecessors had at the same stage, precisely as buyers and investors demand more documentation than ever. Ventures that can still originate new trial data, rather than only repackage old data into new publications, are becoming disproportionately valuable because that capability is getting rarer.
What the three parts add up to
Taken together, this series describes one market and four decisions. The market is industrial rather than experimental: $17.46 billion deployed across 601 rounds in H1 2026, with 6.2% of transactions absorbing 58.4% of capital, a single IPO against 83 acquisitions, and an average path to exit of 10.7 years. The four decisions follow from it in sequence.
The 2027 Budget: Four Decisions and the Evidence Behind Each
| Decision | The test | H1 2026 evidence | Covered in |
|---|---|---|---|
| Where to play | Does the category show adoption and exit activity, not just capital? | Health Management Solutions: 280 partnerships and 22 exits on $1.74 billion. Research Solutions: 193 partnerships and 2 exits on $5.91 billion | Part one |
| How to access capability | Is this differentiating, and do we already hold the underlying assets? | 1,597 corporate partnerships, 83 acquisitions, one IPO | Part two |
| What to fund inside AI | Is the money in the workflow, or in a line item named after the technology? | AI-tagged ventures: 58.1% of rounds, 54.0% of capital, $30.9 million average round against $36.7 million | Part two |
| What to stop and how to measure | Can you name the scale owner, the budget line and the decision date? | 31.8% of partnering ventures signed 2+ corporate partners; Evidence Score 52.9 vs 29.6 by round band | Part three |
The question to answer before your 2027 budget is signed
There is one test that separates an innovation budget from an innovation wish list. Can you explain, line by line, where the money is going and why — in terms of the capability it buys, the access model it uses, the evidence it will generate and the decision it will produce?
Most 2027 budgets will not survive that test on first reading. The ones that do will share a structure: a small number of categories chosen deliberately rather than opportunistically, an explicit build, buy or partner decision for each capability, a portfolio with stated proportions and stated exit criteria, an AI allocation that includes the unglamorous infrastructure layer, and a set of measures that describe outcomes rather than effort.
Two caveats belong alongside that conclusion. H1 2026 partnership and funding counts are preliminary and will revise upward as later-reported deals are backfilled, so the transaction-count declines described across this series should be read as a floor rather than a final figure. And a partnership announcement records that a relationship exists, not its contract value or deployment scope, which makes the multi-partner share the best available proxy for the shift from pilot to scale rather than proof of it.
Neither caveat changes the direction of travel. The market has already decided how it allocates capital: to fewer companies, on more evidence, over longer horizons. The open question is whether corporate innovation budgets will be rebuilt on the same logic, or whether they will keep funding activity in a market that has stopped paying for it.
What this means
For investors: Add partnership depth to the diligence template alongside evidence stock, and introduce evidence velocity as the correction for a metric that structurally favours older companies — average Evidence Score rises from 8.3 for post-2023 cohorts to 28.6 for pre-2005 ones, which is a measure of time in market as much as quality. The ventures winning the largest rounds were already the most evidenced and most adopted in the market before they raised, so a diligence process that disagrees with the capital markets needs an articulable reason for doing so.
For pharma and corporate partners: Take the pilot list apart before the 2027 numbers are locked. Every programme without a named scale owner, budget line and decision date is consuming integration capacity a scalable programme will need next year. Track capital recycled from terminated programmes into funded ones as a first-class metric; without it, a list of things to stop is a document rather than a mechanism.
For health systems and payors: Your leverage has increased and should be spent on integration terms, evidence obligations and data rights rather than on pricing alone. Note also that with 31.8% of partnering ventures now running two or more corporate relationships at once, the vendors in your Scale bucket are being deployed by peer institutions simultaneously — which makes shared evidence standards and comparable integration requirements a collective interest rather than a competitive one.
For digital health ventures: Evidence velocity is the argument to make if your evidence stock is thin, and it is a legitimate one — but it has to be made with data rather than asserted. Build across at least two of trials, approvals and publications rather than one. And recognise that a second and third corporate partnership is now a more persuasive proof point to both investors and enterprise buyers than a funding announcement alone.
FREQUENTLY ASKED QUESTIONS
What is the biggest strategic risk in digital health right now?
Not excessive caution in any single organisation, but the collective effect of it. Early-stage rounds fell 63% between H1 2022 and H1 2026, from 794 to 290. On a decade-long path from incorporation to acquisition, that contraction sets the size of the acquisition and partnership opportunity set available at the end of this decade — which is a problem for every corporate development and innovation team simultaneously.
What is the difference between evidence stock and evidence velocity?
Evidence stock is the cumulative volume of trials, regulatory approvals and publications a venture has on file. Evidence velocity is the rate at which it is generating them relative to cohort peers. Stock rises mechanically with age — average Evidence Score runs from 8.3 for ventures founded since 2023 to 28.6 for those founded before 2005 — so a diligence process weighted to stock alone systematically favours older companies over better ones.
How should an innovation portfolio be structured?
Four buckets, each with one rule. Explore bets are funded small and time-boxed to produce a decision. Validate programmes require the evidence question to be defined before money is released. Scale programmes are constrained by integration capacity rather than conviction. Strategic capabilities are governed at board level and funded multi-year. If you cannot state the percentage of budget in each bucket, you have a list of pilots rather than a portfolio.
Why are clinical trial starts falling while publications rise?
Cost and time are the most likely drivers. New trials are expensive and slow, while secondary analyses, real-world evidence studies and follow-up publications on existing datasets are faster and cheaper, and extend the commercial life of data a venture already holds. Trial starts sit at an index of 68 against 2021, while publications sit at 189 — the sector is formalising existing evidence faster than it is generating new evidence.
Which metrics should replace pilot counts?
Five: the proportion of the portfolio aligned to stated strategic priorities; deployments and renewals rather than launches; evidence and regulatory milestones achieved; time from pilot to scale decision; and capital recycled out of terminated programmes into funded ones. The last is the least commonly tracked and the most useful, because it makes subtraction visibly fund addition.
Data source and methodology
Data source: HealthTech Alpha by Galen Growth, accessed September 2026, covering venture financing, venture–corporate partnership activity, M&A and exit transactions, clinical trial records, peer-reviewed publications, venture profiles and proprietary venture scores across the global digital health ecosystem. Funding analysis covers H1 (1 January–30 June) periods from 2022 to 2026 and excludes M&A, IPO, SPAC, post-IPO equity, pre-IPO, delisted and secondaries transactions unless exit activity is being analysed directly. Figures are in US dollars.
Round-size bands group ventures by their largest disclosed H1 2026 round, so each venture is counted once. Scores are HealthTech Alpha proprietary 0–100 measures and reflect a venture’s current, not historical, position. Evidence Score is cumulative and therefore correlates with company age. Clinical trial and publication series exclude 2026, because current-year records remain materially incomplete at the time of writing. H1 2026 funding and partnership counts are preliminary and are expected to revise upward as later-reported transactions are disclosed and classified, so year-on-year declines in transaction counts should be read as a floor.
Galen Growth is the Healthcare Innovation Intelligence company behind HealthTech Alpha. Built on proprietary data, AI-enabled workflows and expert insights, HealthTech Alpha delivers decision-grade intelligence that helps healthcare leaders identify opportunities, evaluate companies and make better strategic decisions.
Related Galen Growth analysis
- Digital Health Budget Planner — Galen Growth interactive tool and full 2027 planning manual
- The Ten-Week Window: A Q4 Planning Guide for Your 2027 Digital Health Budget (part one of this series)
- Build, Buy or Partner: How to Spend a 2027 Digital Health Budget (part two of this series)
- Digital Health Funding 2026: Ventures with Strong Clinical Evidence Raise 3.5x More
- The Maturity Era: Digital Health Funding, H1 2026
Disclaimer
This analysis is provided solely for informational purposes and was prepared in good faith on the basis of public information available at the time of publication without independent verification. Numbers will be updated from time to time to reflect information identified after the event. Galen Growth does not guarantee or warrant the reliability or completeness of the data nor its usefulness in achieving any particular purposes. Galen Growth shall not be liable for any loss, damage, cost or expense incurred by any reason because of any person’s use or reliance on this report.