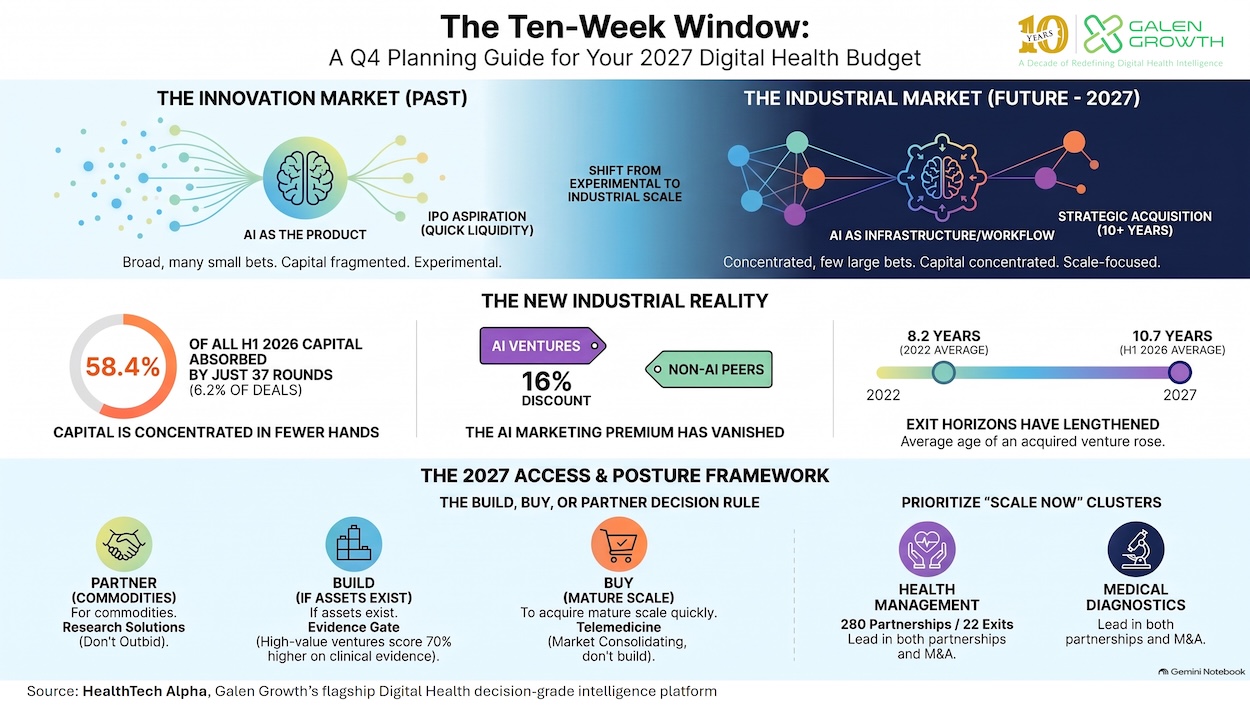
Most 2027 innovation budgets will be written in the next ten weeks. This three-part guide is built for that calendar: what to fund, how to access it, and what to stop. Part one settles the question everything else depends on — what kind of market are you actually budgeting into?
Part one of three, published across the Q4 2026 planning window. Part two covers how to access capability — build, buy or partner. Part three covers what to stop, how to measure what remains, and what the series adds up to. Both are intended for publication on 22 and 29 September respectively; dates are subject to change.
KEY TAKEAWAYS
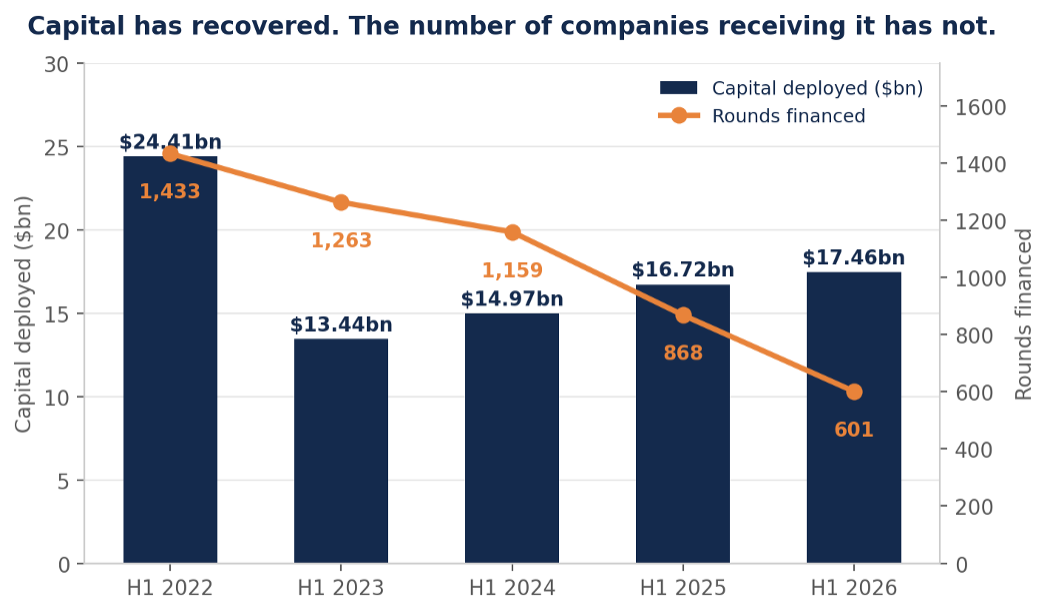
- Budget for scarcity of companies, not scarcity of capital. H1 2026 digital health funding reached $17.46 billion across 601 rounds, against $24.41 billion across 1,433 rounds in H1 2022 — capital down 28%, financed companies down 58%, and the average disclosed round up from $18.7 million to $33.3 million.
- Treat concentration as a planning assumption. Thirty-seven rounds of $100 million or more — 6.2% of all transactions — took 58.4% of H1 2026 capital, up from 41.0% in H1 2022. Your 2027 sourcing pipeline is competing for a materially smaller set of fundable assets.
- Risk appetite has not disappeared; it has moved up the curve. Growth-stage capital rose to $6.32 billion and late-stage to $4.43 billion in H1 2026, while early-stage capital fell to $3.17 billion across 290 rounds — down from 794 rounds four years earlier.
- Do not use a funding league table as an opportunity map. Research Solutions took $5.91 billion — a third of all capital — across 69 rounds, but generated 193 corporate partnerships and two acquisitions. Health Management Solutions raised $1.74 billion and produced 280 partnerships and 22 acquisitions.
- Adoption intensity is the better predictor of what you can deploy next year. Health Management Solutions and Medical Diagnostics combine the deepest enterprise partnership activity (280 and 273) with the highest acquisition counts (22 and 11) on moderate capital intensity — the profile of categories ready to scale rather than categories being bid up.
It is Q4, which means most healthcare innovation teams are a few weeks from a budget submission and rather further from a settled view of what to put in it. Between now and the end of the year, the allocations that will govern 2027 — which categories get funded, which pilots survive, which partnerships get integration capacity — will be argued over, drafted and signed. Ten weeks, give or take.
Trends reports answer the question of what changed. They rarely answer the two questions that actually determine an allocation: what should we stop doing, and where should the money go? And they almost never answer them in a form you can take into a budget meeting before the submission deadline.
This series is built the other way round, and it is built for the calendar you are on. It starts from the four decisions that have to be made before a 2027 budget can be signed, and puts a number against each one using HealthTech Alpha data through September 2026. Work through the three parts in order and you should finish with a defensible allocation rather than a list of themes. Every section ends with the budget implication, not the observation.
Here is the sequence, and what each part is for.
The 2027 Budget Series: Four Decisions Across Three Parts
| Part | The decision | The question it answers | Published |
|---|---|---|---|
| Part one — this article | Where to play | What kind of market am I budgeting into, and which categories are ready to scale rather than merely well funded? | 15 September |
| Part two | How to access capability | Do I build, buy or partner for this — and what should the AI line item actually contain? | 22 September (intended) |
| Part three | What to stop, and how to measure what remains | Which programmes should not survive the budget round, and what replaces pilot counts as a metric? | 29 September (intended) |
The rest of this article deals with the first decision, and it begins with a distinction that changes the arithmetic of everything that follows.
Digital health has not contracted. It has industrialised.
Those are different markets and they require different budgets, so the distinction is worth making precisely.
In H1 2026, $17.46 billion of primary capital was deployed across 601 funding rounds. Four years earlier, in H1 2022, $24.41 billion went into 1,433 rounds. Capital fell 28%. The number of financed companies fell 58%. The average disclosed round rose from $18.7 million to $33.3 million, and H1 2026 capital sits above the $16.72 billion recorded in H1 2025 and well above the 2023 trough of $13.44 billion.
Nothing in that pattern says the sector is shrinking. It says the sector has stopped subsidising experimentation and started paying for scale.
H1 Digital Health Funding vs Rounds Financed, 2022–2026
The stage data explains where the money went. Early-stage rounds — angel through Series A — fell from 794 in H1 2022 to 290 in H1 2026, with capital down from $6.50 billion to $3.17 billion. Growth-stage capital moved in the opposite direction, rising from $4.68 billion in H1 2025 to $6.32 billion in H1 2026 across just 103 rounds, while late-stage capital reached $4.43 billion across 36. The market has not lost its appetite for risk. It has moved that appetite to companies that have already removed some of it.
H1 Digital Health Capital by Stage Band, 2022–2026
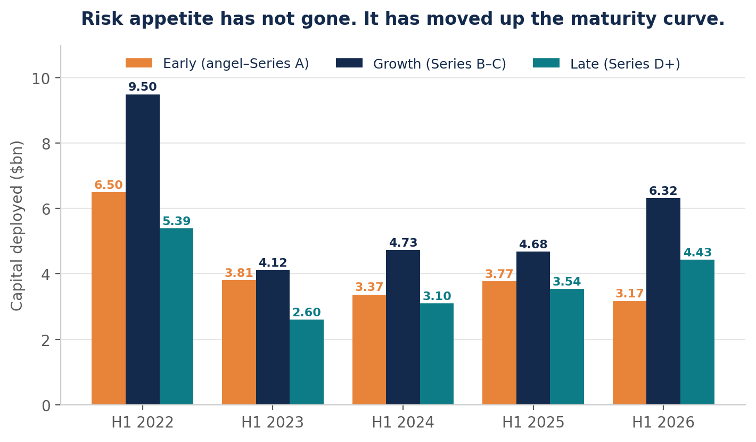
The practical consequence for an innovation team is straightforward and slightly uncomfortable. The population of investable, partnerable and acquirable companies in your category is materially smaller than your 2024 pipeline assumed, and each of the companies still in it is better capitalised, more mature and more sought-after than its equivalent two years ago. Scarcity, not abundance, is the planning assumption for 2027.
Concentration is a planning assumption, not a headline
The concentration figure is the one to carry into the budget meeting. Thirty-seven rounds of $100 million or more closed in H1 2026. They represented 6.2% of all transactions and absorbed 58.4% of all capital deployed. In H1 2022, 51 such rounds represented 3.6% of transactions and 41.0% of capital.
Read carefully, that is two movements at once. The share of transactions that are mega-rounds has nearly doubled, and the share of capital they absorb has risen by more than seventeen percentage points. Concentration is not merely persisting; it is intensifying on both measures simultaneously.
If your 2027 plan still assumes the market of 2021, it is priced for a market that no longer exists. The table below sets out the shift row by row, with the H1 2026 evidence against each. Each line is a budgeting assumption rather than a slogan; the test is whether your own plan sits on the left-hand column or the right.
What Changed: The Innovation Market and the Industrial Market
| Dimension | The market you planned for | The market you are budgeting into | H1 2026 evidence |
|---|---|---|---|
| Capital | Broad, many bets | Concentrated, few bets | 6.2% of rounds took 58.4% of capital |
| Product | Point solutions | Platforms and infrastructure | Health Management Solutions led both partnerships (280) and M&A (22) |
| Commercial | Pilots | Deployment at scale | 31.8% of partnering ventures signed two or more corporate partners in the half |
| Differentiation | Novelty | Evidence | Recipients of rounds of $100 million or more score 52.9 on Evidence against 29.6 for rounds below $25 million |
| Technology | AI as the product | AI as infrastructure | Self-described AI ventures took 58.1% of rounds but no size premium |
| Access model | Build | Build, buy or partner | 83 M&A transactions against a single IPO in H1 2026 |
| Liquidity | IPO aspiration | Strategic acquisition | Average 10.7 years from incorporation to acquisition |
Funding league tables are a map of investor conviction, not of enterprise demand
The most common mistake in 2027 planning will be to treat a funding ranking as an opportunity map. It is not one, and in H1 2026 the two point in visibly different directions.
Research Solutions attracted $5.91 billion — roughly a third of all digital health capital — across only 69 rounds, at an average disclosed round of $98.4 million. It generated 193 corporate partnerships and two acquisitions. Health Management Solutions attracted $1.74 billion across 91 rounds at an average of $21.5 million, and produced 280 corporate partnerships and 22 acquisitions. Medical Diagnostics raised $1.45 billion and produced 273 partnerships and 11 acquisitions. On a capital map, Research Solutions dominates. On an adoption map, it is a distant third.
Cluster Positioning: Capital Intensity vs Adoption Intensity, H1 2026
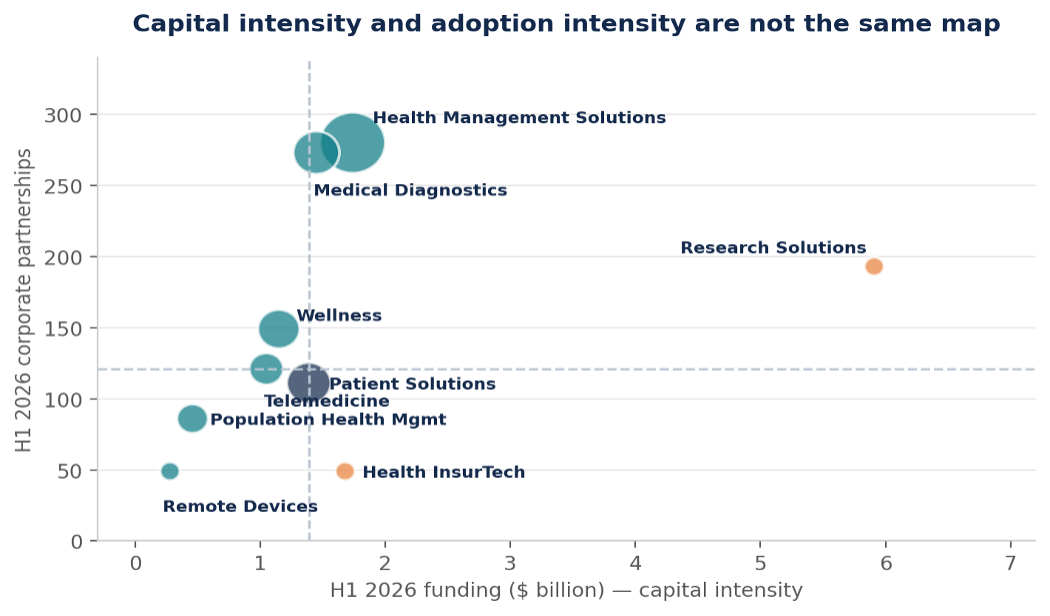
Read on that measure, Medical Diagnostics generates 188 corporate partnerships per $1 billion raised and Health Management Solutions 161, against 33 for Research Solutions and 29 for Health InsurTech. Two smaller clusters, Population Health Management and Remote Devices, are also adoption-efficient — 187 and 175 partnerships per $1 billion — but on much smaller absolute volumes of 86 and 49 partnerships, which is why they sit in the monitoring tier of the opportunity map below rather than the scaling one. Efficiency and scale are different claims, and a 2027 allocation needs both.
Neither map is wrong. They answer different questions. Capital intensity tells you where a small number of platform-scale bets are being made and, by implication, where you will be outbid. Adoption intensity tells you where your peer institutions are already committing budget, integration effort and clinical governance attention — which is a far better predictor of what you will actually be able to deploy in 2027.
The 2027 opportunity map: where capital, adoption and exits line up
Reading the two maps together produces a usable classification. Where adoption and exit activity are both high relative to capital, the category is ready to scale and the binding constraint is your own integration capacity rather than your conviction. Where capital is high but adoption is thin, the category is worth partnering into rather than competing in. Where both are thin and falling, the honest answer is to defer — hold the allocation back rather than commit it, and revisit when there is something worth buying.
The 2027 Opportunity Map by Cluster
| Cluster | H1 2026 funding | Rounds | Corporate partnerships | M&A exits | 2027 posture |
|---|---|---|---|---|---|
| Health Management Solutions | $1.74 billion | 91 | 280 | 22 | Scale now |
| Medical Diagnostics | $1.45 billion | 100 | 273 | 11 | Scale now |
| Research Solutions | $5.91 billion | 69 | 193 | 2 | Partner, do not outbid |
| Patient Solutions | $1.39 billion | 69 | 111 | 10 | Build selectively |
| Wellness | $1.15 billion | 43 | 149 | 9 | Build selectively |
| Telemedicine | $1.05 billion | 42 | 121 | 6 | Consolidating — buy, do not build |
| Population Health Management | $0.46 billion | 28 | 86 | 5 | Monitor |
| Health InsurTech | $1.68 billion | 29 | 49 | 2 | Monitor |
| Remote Devices | $0.28 billion | 30 | 49 | 2 | Monitor |
| Online Health Communities | Under $10 million | 1 | 9 | 0 | Defer |
Run the same exercise against your own priorities before you accept ours. The three inputs that matter are capital momentum, partnership momentum and exit activity, and all three are visible for every cluster and category in the dataset. What you should not do is lift a single dollar-share figure from a single half-year and treat it as a category verdict.
The regional layer: where the scarcity bites hardest
Concentration has a geography, and it is not uniform. North America still commands the largest pool of capital by a wide margin, but it contracted fastest on deal count: 309 rounds in H1 2026 against 452 a year earlier, with capital broadly flat. Europe held its capital almost exactly steady while financing 30% fewer companies. APAC was the only major region where capital grew materially, up 80% year on year, though from a much smaller base and concentrated in a handful of large transactions.
Regional Funding Comparison, H1 2025 vs H1 2026
| Region | H1 2025 capital | H1 2026 capital | H1 2025 rounds | H1 2026 rounds | Planning implication |
|---|---|---|---|---|---|
| North America | $10.42 billion | $10.10 billion | 452 | 309 | Same money, far fewer targets — expect to be outbid more often |
| Europe | $4.66 billion | $4.69 billion | 272 | 190 | Flat capital into a thinner field; cheque sizes rising fastest here |
| APAC | $1.28 billion | $2.31 billion | 109 | 85 | Capital growing against a shrinking deal count — the sharpest concentration of the three |
Where this map will mislead you
Two caveats belong in the plan alongside the numbers, and they cut in opposite directions.
The first is timing. H1 2026 funding and partnership counts are preliminary and will revise upward as later-reported transactions are disclosed and classified. The corporate partnership figure of 1,597 should be read as a floor, not a final count, and the same applies to round counts. Year-on-year declines in transaction volume are therefore an upper bound on the true contraction.
The second is volatility. A single half-year of dollar share is a noisy signal for any one category, and the temptation to build a category strategy on one reading should be resisted. Research Solutions has swung across a wide band on dollar share in recent periods, and any thesis anchored to a single figure will need rewriting by the next release. Partnership counts and acquisition counts are steadier because they accumulate from many small decisions by many buyers rather than a handful of large ones by a handful of investors — which is precisely the argument for weighting them more heavily in a planning exercise.
There is also a limit to what the adoption map can tell you. A partnership announcement records that a relationship exists. It does not record its contract value, deployment scope or renewal likelihood. Adoption intensity is the best available proxy for enterprise demand, not a measurement of it.
Next: choosing how to access the capability
Choosing a category is the easier half of a budget decision. The harder half is how you get hold of the capability once you have chosen — and in a market where 83 acquisitions closed against a single IPO in six months, and where the average acquired venture is now more than a decade old, the default answers most teams reach for are the wrong ones.
Part two, intended for 22 September, takes that question apart. It covers the finding that the AI label has gone from a 39% funding premium to a 16% discount, the four-rung ladder from feature to infrastructure that should drive your roadmap, and a decision rule for build, buy or partner that starts with differentiation rather than with whichever route procurement finds easiest.
What this means
For investors: Rebuild the 2027 deployment model around concentration rather than reacting to it next year. With 6.2% of rounds absorbing 58.4% of capital, sourcing breadth is no longer the differentiator it was — the constraint is access to a small, well-identified set of assets. Weight partnership and exit activity alongside funding momentum when sizing category exposure, because the categories attracting the largest cheques and the categories generating the most enterprise traction are visibly not the same ones.
For pharma and corporate partners: Use the adoption map, not the capital map, to set 2027 category priorities. Research Solutions will be the most expensive place to compete and among the cheapest places to partner, given that 69 rounds absorbed a third of all capital while generating relatively modest partnership volume. Health Management Solutions and Medical Diagnostics are where your peers are already committing integration effort, which makes both counterparty scarcity and competitive crowding foreseeable rather than surprising.
For health systems and payors: The shrinking financed population changes your vendor risk profile before it changes your pricing. Fewer, better-capitalised vendors means fewer alternatives if a partner is acquired or pivots, so concentration risk in the supplier base deserves the same scrutiny as commercial terms. Treat Health Management Solutions and diagnostics partners as infrastructure decisions from day one; these are the categories with both the deepest partnership activity and the highest acquisition rates.
For digital health ventures: Your 2027 revenue is being written into corporate and health-system budgets during exactly this quarter, which makes Q4 the moment to convert conversations into named line items rather than a quiet period before a January push. With the average disclosed round at $33.3 million and early-stage rounds down 63% in four years, arriving at a raise with adoption evidence rather than a category narrative is no longer an advantage — it is the entry condition.
FREQUENTLY ASKED QUESTIONS
Is digital health funding declining going into 2027?
Not in capital terms. H1 2026 recorded $17.46 billion of primary funding, above the $16.72 billion of H1 2025 and well above the 2023 trough of $13.44 billion. What has fallen is the number of companies receiving it: 601 rounds in H1 2026 against 1,433 in H1 2022, a 58% decline. The correct planning assumption is scarcity of fundable companies, not scarcity of capital.
Which digital health categories deserve the most attention in 2027?
On the H1 2026 data, Health Management Solutions and Medical Diagnostics combine the deepest enterprise adoption — 280 and 273 corporate partnerships respectively — with the highest acquisition activity, at 22 and 11 exits, on moderate capital intensity. Research Solutions leads on capital by a wide margin at $5.91 billion, but that total is concentrated in a small number of platform-scale bets rather than broad enterprise deployment.
Why use partnership counts rather than funding totals to choose categories?
Funding records an investor’s view of future value. A partnership records a buyer committing budget, integration effort and clinical governance attention to a product now. For a team planning what it can deploy next year, the second is the more relevant signal. Partnership counts are also steadier: they aggregate many small decisions by many buyers, where dollar share can swing sharply on two or three large rounds.
How concentrated is digital health capital actually getting?
Thirty-seven rounds of $100 million or more accounted for 58.4% of all H1 2026 capital while representing 6.2% of transactions. Four years earlier the equivalent figures were 41.0% and 3.6%. Both the share of transactions that are mega-rounds and the share of capital they absorb are rising, which means concentration is intensifying rather than levelling off.
Should we trust H1 2026 figures given the reporting lag?
Treat them as a floor. Funding and partnership counts revise upward as later-reported transactions are disclosed and classified, so year-on-year declines in volume are an upper bound on the true contraction. The direction of travel — fewer companies, larger cheques, deeper concentration — has held across five consecutive half-year periods and is not an artefact of the lag.
Data source and methodology
Data source: HealthTech Alpha by Galen Growth, accessed September 2026, covering venture financing, venture–corporate partnership activity, M&A and exit transactions, venture profiles and market positioning across the global digital health ecosystem. Funding analysis covers H1 (1 January–30 June) periods from 2022 to 2026 and excludes M&A, IPO, SPAC, post-IPO equity, pre-IPO, delisted and secondaries transactions unless exit activity is being analysed directly. Figures are in US dollars.
H1 2026 funding and partnership counts are preliminary and are expected to revise upward as later-reported transactions are disclosed and classified, so year-on-year declines in transaction counts should be read as a floor. Average round sizes are calculated on disclosed amounts only. Cluster and regional attribution follow the venture’s primary HealthTech Alpha cluster and headquarters location respectively.
Galen Growth is the Healthcare Innovation Intelligence company behind HealthTech Alpha. Built on proprietary data, AI-enabled workflows and expert insights, HealthTech Alpha delivers decision-grade intelligence that helps healthcare leaders identify opportunities, evaluate companies and make better strategic decisions.
Related Galen Growth analysis
- The Maturity Era: Digital Health Funding, H1 2026
- H1 2026 Digital Health Trends: Why Partnerships Matter More Than Funding
- Healthcare Is Buying Infrastructure, Not Apps
- Digital Health Investment Trends in H1 2026: 5 New Rules of Healthcare Innovation Venture Capital
Disclaimer
This analysis is provided solely for informational purposes and was prepared in good faith on the basis of public information available at the time of publication without independent verification. Numbers will be updated from time to time to reflect information identified after the event. Galen Growth does not guarantee or warrant the reliability or completeness of the data nor its usefulness in achieving any particular purposes. Galen Growth shall not be liable for any loss, damage, cost or expense incurred by any reason because of any person’s use or reliance on this report.