
As the first in a series covering the key digital health stories from H1 2026, this article concentrates on equity funding trends. Exits and M&A activity will be explored in a forthcoming companion piece.
KEY TAKEAWAYS
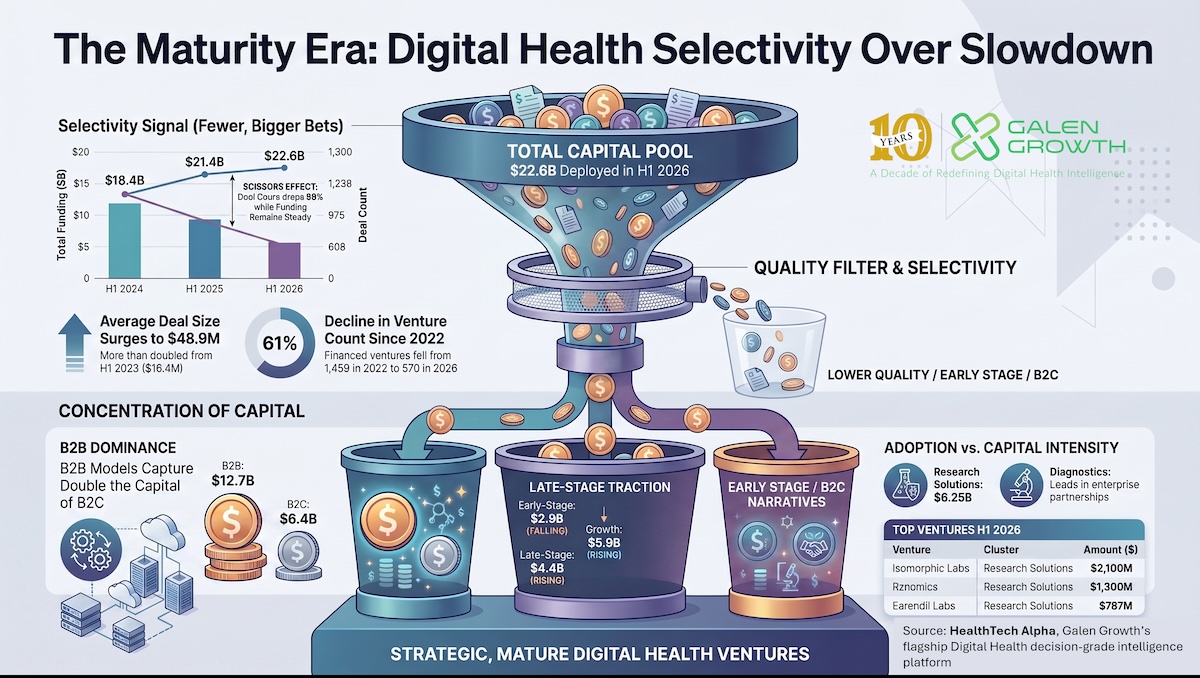
- Treat H1 2026 as a selectivity story, not a slowdown story. Global digital health funding reached $22.6B, broadly flat from $21.4B in H1 2025, while the deal count fell to 608 from 975. Investors are still deploying capital, but the bar for who receives it has risen sharply.
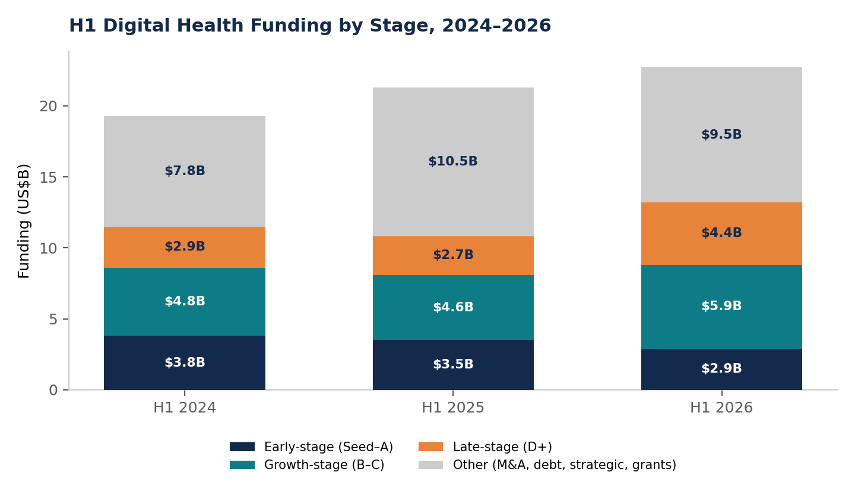
- Prioritise proof of commercial traction over category momentum. Growth-stage capital rose to $5.9B and late-stage funding climbed to $4.4B, while early-stage funding fell to $2.9B — signalling that the market is rewarding ventures with validated demand, a repeatable sales motion, and clearer operating discipline at every stage beyond formation.
- Use enterprise adoption as a diligence signal, but not as proof on its own. Corporate partnerships remain concentrated among healthcare providers and pharmaceutical companies, yet H1 2026 partnership figures should be read as a preliminary floor because later-reported deals are likely to revise the count upward.
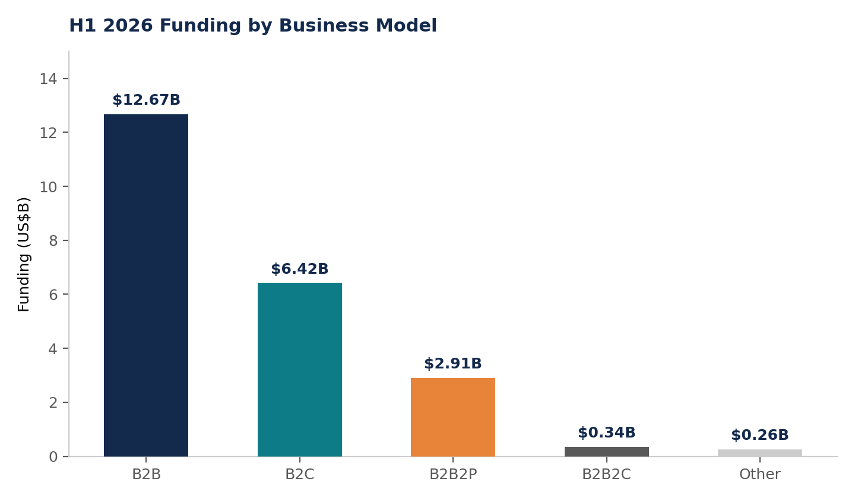
- Expect B2B and B2B2P models to command the quality premium. B2B ventures captured $12.7B versus $6.4B for B2C, showing that institutional buyers, not consumer-growth narratives, are setting the market’s centre of gravity.
- Separate platform-scale conviction from broad-based maturity. Research Solutions attracted $6.25B, roughly 28% of H1 2026 funding, but much of that total is concentrated in a few mega-rounds. Diagnostics and Health Management Solutions show a different maturity profile: less capital intensity, but deeper partnership activity.
The era of easy growth is over — but capital has not left the building
Digital health has not collapsed, and it has not lost relevance. What has changed is the basis on which capital is being allocated. H1 2026 global digital health recorded $22.6B of funding, broadly in line with $21.4B in H1 2025 and still below the $28.7B deployed in H1 2022. The headline total is therefore less important than the shape of the market beneath it.
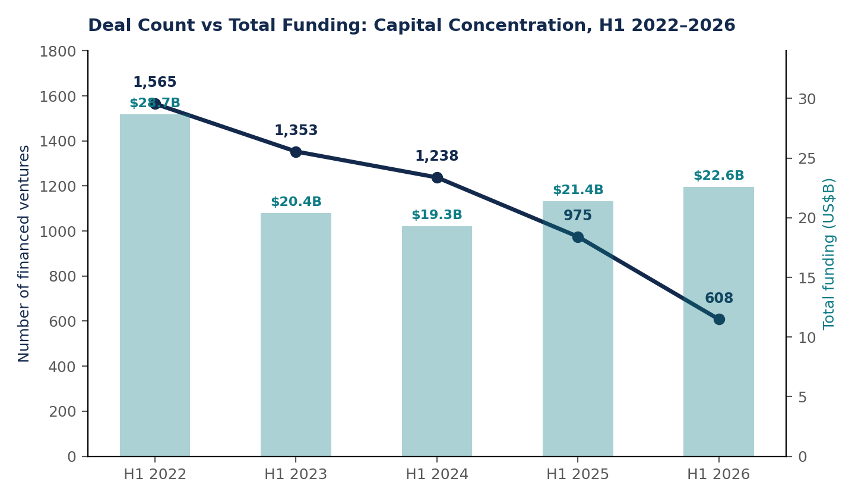
Deal count has fallen every year since 2022: 1,565 rounds in H1 2022, 1,353 in H1 2023, 1,238 in H1 2024, 975 in H1 2025 and 608 in H1 2026. That is a 61% decline in four years. Average deal size has moved in the opposite direction, rising from $18.4M in H1 2023 to $48.9M in H1 2026. Fewer ventures are clearing the funding bar; those that do are receiving materially larger cheques.
That is not a market in retreat. It is a market applying a quality filter. Investors have not stopped believing in digital health; they have stopped rewarding digital ambition on its own. The founder question has shifted from “is this category investable?” to “has this company earned the right to scale?”
H1 Digital Health Funding vs Average Deal Size, 2022–2026
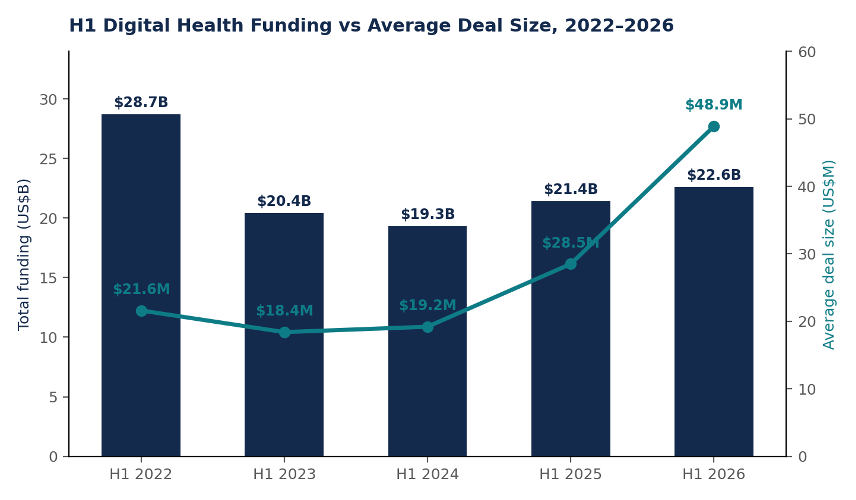
Source: HealthTech Alpha, July 2026. Total capital deployed has held broadly steady since H1 2024, while the average cheque size has more than doubled — the clearest signal that H1 2026 is a selectivity story, not a slowdown story.
The stage data sharpens the picture. Early-stage funding — seed through Series A — fell to $2.9B in H1 2026 from $3.8B in H1 2024, while growth-stage funding — Series B and C — rose to $5.9B from $4.8B over the same period. Late-stage funding also expanded, climbing to $4.4B from $2.9B. Capital is not simply concentrating at the top of the market; it is migrating away from unproven formation-stage bets and toward ventures that have already demonstrated commercial traction, at every stage beyond formation.
H1 Digital Health Funding by Stage, 2024–2026
The ten largest disclosed financings of H1 2026 illustrate where conviction is concentrating. Six of the ten sit in Research Solutions or adjacent AI-biology categories, and the list is dominated by business models that sell into enterprises, pharmaceutical companies, or payer/provider channels rather than relying on direct-to-consumer growth alone.
Top 10 Disclosed Growth Financings, H1 2026
| Venture | Cluster | Stage | Business model | Region | Amount | Lead investor(s) |
| Isomorphic Labs | Research Solutions | Series B | B2B | Europe | $2,100M | Thrive Capital |
| Rznomics | Research Solutions | Strategic | B2B | APAC | $1,300M | Lilly |
| Earendil Labs | Research Solutions | Strategic | B2B | North America | $787M | Dimension Capital, DST Global +5 |
| WHOOP | Wellness | Series G | B2C | North America | $575M | Collaborative Fund |
| Alan | Health InsurTech | Series G1 | B2C | Europe | $455.9M | Prosus Ventures, Index Ventures |
| Generate Biomedicines | Research Solutions | IPO | B2B | North America | $400M | Public offering |
| Devoted Health | Health InsurTech | Series F | B2C | North America | $366M | The Space Between, Centricus |
| Verily | Health Mgmt Solutions | Series E | B2B2P | North America | $300M | Series X Capital |
| OpenEvidence | Medical Education | Series D | B2C | North America | $250M | Thrive Capital, DST Global |
| Oviva | Patient Solutions | Series D | B2B2P | Europe | $235M | Kinnevik AB |
Enterprise adoption has become the market’s real due-diligence process
In a more disciplined funding market, commercial relationships are doing work that pitch decks used to do. A partnership with a health system, payer, pharmaceutical company or technology platform is no longer primarily a visibility event. It is evidence that a product can survive procurement, integrate into clinical or administrative workflow, and satisfy a buyer sophisticated enough to say no. In the maturity era, adoption is the new hype cycle.
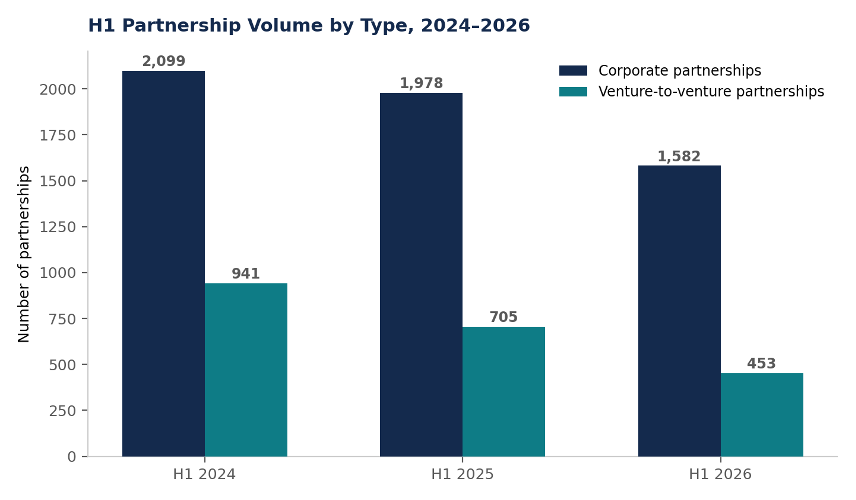
H1 2026 recorded 1,582 corporate partnerships, down from 1,978 in H1 2025 and 2,099 in H1 2024. Venture-to-venture partnerships declined more sharply, from 941 in H1 2024 to 453 in H1 2026. Read at face value, that looks like adoption cooling alongside funding. It should be read more cautiously: partnership disclosures accumulate over months after the fact, and the H1 2026 monthly pattern shows a pronounced dip in April, May, and June (278, 195, and 152 deals, respectively) after a stronger January to March (346, 285, and 326). That pattern is consistent with reporting lag rather than a sudden collapse in enterprise dealmaking. H1 2026 figures should therefore be treated as a preliminary floor likely to revise upward.
H1 Partnership Volume by Type, 2024–2026
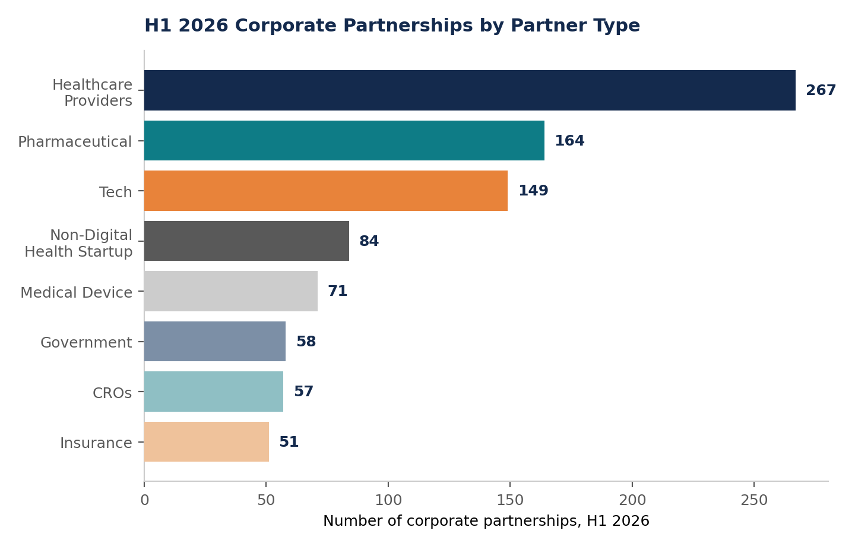
Even with that caveat, the composition of H1 2026 partnerships is informative. Healthcare providers accounted for 267 corporate partnerships, the single largest category, followed by pharmaceutical companies (164) and technology corporates (149). Insurers, government bodies and research institutions rounded out the buyer base. Employers are not currently tracked as a distinct partner category, so that segment of enterprise demand — material in areas such as workplace wellness and virtual-first primary care — cannot be isolated from the current partner-type analysis.
H1 2026 Corporate Partnerships by Partner Type
The market is rewarding commercial execution over product novelty
The strongest ventures in this market are not necessarily those with the most novel technology. They are the ones that can sell into complex healthcare organisations, integrate into existing workflows, demonstrate measurable outcomes, and survive buying cycles that routinely run for 12 to 18 months. Digital health’s next winners will not be defined only by what they build, but by what they can get adopted, reimbursed, integrated and renewed.
The business-model split in H1 2026 funding makes the point numerically. B2B ventures captured $12.7B across 332 deals, more than B2C’s $6.4B across 173 deals. B2B2P models — ventures that sell through a provider or payer intermediary to reach patients — added an additional $2.9B. Consumer-facing digital health has not disappeared: WHOOP’s $575M Series G and Alan’s $455.9M Series G1 both featured among H1 2026’s largest rounds. But the centre of gravity in capital allocation has moved decisively toward ventures with an enterprise sales motion.
H1 2026 Funding by Business Model
Profitability discipline has moved from investor preference to market requirement
Profitability is not directly captured in the underlying funding and partnership data, and the signal should not be over-interpreted as proof that every successful digital health company is now profitable. What the market does show is a set of signals consistent with a sector prioritising credible paths to sustainability over growth at any cost.
The clearest signal is capital concentration. The number of distinct ventures receiving funding in H1 fell from 1,459 in H1 2022 to 570 in H1 2026, a 61% decline, while total capital deployed fell by a much smaller 21% over the same period. Fewer companies are absorbing a comparable — and in H1 2026 a slightly larger year-on-year — pool of capital. That is the signature of a market rationing attention toward ventures it believes can reach sustainable unit economics, not one abandoning the sector.
Deal Count vs Total Funding: Capital Concentration, H1 2022–2026
Consolidation activity points in the same direction. H1 2026 recorded 82 digital health M&A transactions worth a combined $5.15B, versus 118 transactions worth $3.62B in H1 2025 — fewer deals, but $1.5B more disclosed value, driven by large acquisitions including Eucalyptus ($1.11B), PathAI ($1.05B) and Talkspace ($865M). IPO activity, by contrast, thinned to a single H1 2026 listing — Generate Biomedicines at $400M — from seven in each of H1 2024 and H1 2025. Strategic acquirers are paying up for proven assets while the public listing route remains largely closed. In that environment, credible profitability, not narrative growth, becomes the currency that clears a deal.
Evidence is becoming commercial infrastructure, not a scientific accessory
The maturity-era thesis needs an outcomes dimension. Venture-level Evidence and Partnership scores enable testing of how proof and adoption interact across the market. For enterprise buyers, evidence reduces procurement risk. For pharmaceutical partners, it supports integration into clinical development and patient journeys. For payers, it underwrites reimbursement and renewal. For investors, it separates a scalable business from a feature dressed up as a company.
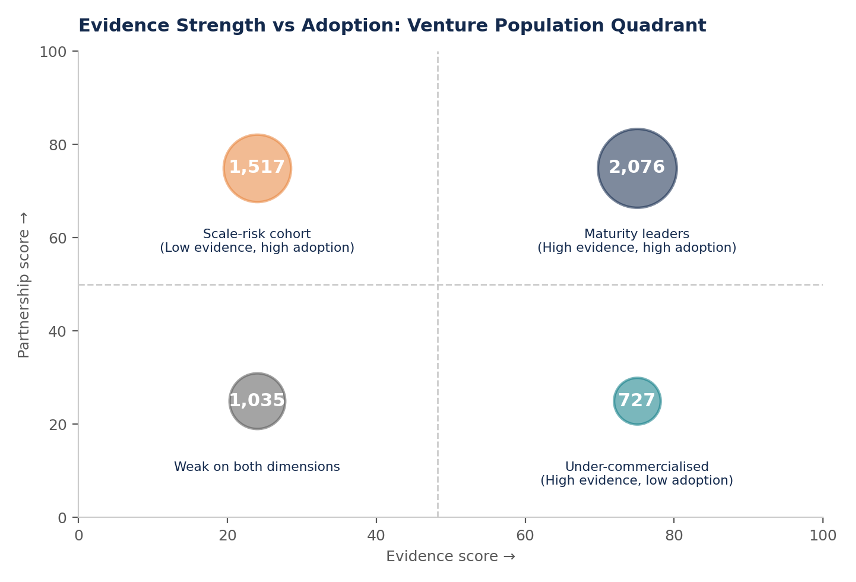
Segmenting the tracked venture population by evidence strength and partnership intensity produces four distinct groups. The 2,076 ventures in the high-evidence, high-adoption quadrant are maturity leaders: their clinical or outcome data and commercial traction reinforce one another. A further 1,517 ventures show high adoption but comparatively weak evidence. This is the scale-risk cohort — companies that have out-run their own proof and are most exposed if buyers tighten procurement standards. Another 727 ventures have built strong evidence without commensurate adoption, making them under-commercialised assets that may be acquisition, licensing or channel-partnership targets for slower-moving incumbents. The remaining 1,035 ventures are weak on both dimensions and are most vulnerable to the funding contraction described above.
Evidence Strength vs Adoption: Venture Population Quadrant
Where is the maturity era furthest along — by cluster, and by region?
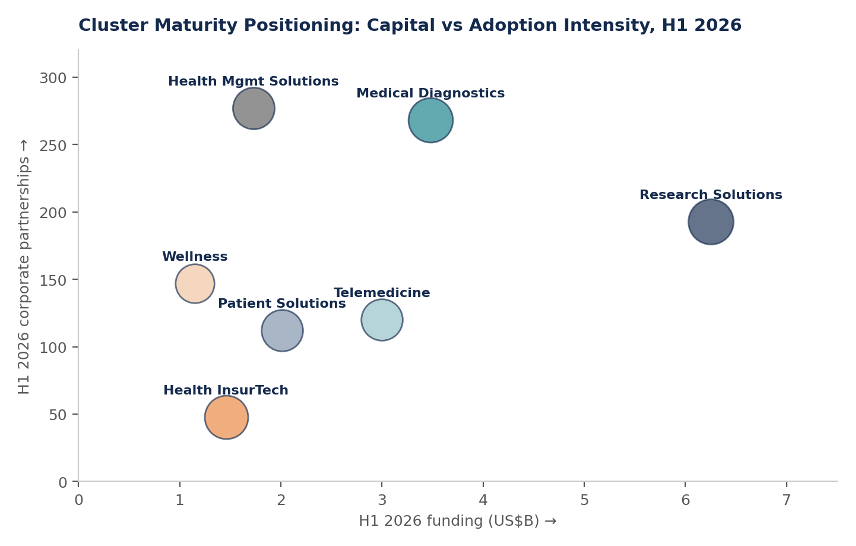
Digital health is maturing, but not uniformly. Plotting H1 2026 funding intensity against partnership intensity by cluster shows Health Management Solutions and Medical Diagnostics generating the deepest enterprise partnership activity relative to capital raised: 277 and 268 corporate partnerships respectively, against more moderate funding totals. These categories appear to be adopted ahead of, rather than because of, large financing rounds.
Research Solutions sits at the opposite pole. It attracted the largest total funding by a wide margin — $6.25B — but its partnership volume (193 deals) is proportionally smaller. That reflects a cluster whose capital is currently concentrated in a small number of platform-scale AI-biology bets rather than broad enterprise deployment.
Cluster Maturity Positioning: Capital vs Adoption Intensity, H1 2026
Regional patterns confirm that the path to maturity is local, even where the destination looks similar. North America still commands the largest absolute pool of capital and partnerships but contracted fastest on both dimensions in H1 2026. Europe’s total funding rose sharply, though the increase is concentrated in a small number of flagship rounds, led by Isomorphic Labs’ $2.1B Series B. APAC’s partnership volume proved the most resilient of the three major regions, even as its funding remained comparatively volatile.
Regional Comparison, H1 2025 vs H1 2026
| Region | Funding trend, H1’25→H1’26 | Partnership trend, H1’25→H1’26 | Dominant clusters | Dominant buyer type | Strategic implication |
| North America | $15.5B → $12.9B (−17%); deals 535→309 | 1,020 → 812 (−20%) | Research Solutions, Telemedicine | Healthcare providers, Tech | Pulling back on breadth even as cheque sizes rise |
| Europe | $3.7B → $5.9B (+60%); deals 283→190 | 412 → 281 (−32%) | Research Solutions, Medical Diagnostics | Healthcare providers, Tech | Growth concentrated in a few flagship AI-biology rounds |
| APAC | $1.7B → $3.5B (+105%); deals 121→91 | 496 → 466 (−6%, most resilient) | Research Solutions, Telemedicine | Pharmaceutical, Healthcare providers | Partnership activity proving sturdier than volatile funding |
What this means
For investors: Shift from broad-category exposure to disciplined company selection. Prioritise ventures with enterprise traction, repeatable commercial models, credible evidence and a plausible path to profitability. Treat the 1,517-venture high-adoption/low-evidence cohort as a due-diligence flag, not a green light.
For pharma and corporate partners: Assess partnerships for resilience, governance and strategic dependency, not only innovation value. As the venture base consolidates, partnership risk — including the risk that a venture does not survive to its next round or is acquired by a competitor — deserves the same diligence as commercial upside.
For health systems and payers: Use the market reset to demand more. Providers and payers now have greater leverage to require proof, integration and measurable ROI as conditions of adoption. The data suggests they are already shaping which ventures get built.
For digital health ventures: Growth metrics alone no longer clear the bar. The strongest companies in H1 2026 are proving adoption, evidence, revenue quality and operating discipline simultaneously. Investors are pricing that combination at more than double the average deal size of two years ago.
Frequently asked questions
FAQ
What does the “maturity era” mean for digital health in H1 2026?
It means the sector is now being judged on execution quality — commercial traction, enterprise adoption, evidence and credible profitability paths — rather than on growth or funding volume alone. Total capital is broadly flat year-on-year, but deal count and average round size have moved sharply in opposite directions, the classic signature of a market applying a quality filter.
Is digital health funding actually declining in H1 2026?
Not in dollar terms. Total H1 2026 funding of $22.6B is broadly in line with $21.4B in H1 2025 and higher than H1 2023 or H1 2024. What has fallen sharply is the number of financed ventures, from 975 in H1 2025 to 608 in H1 2026, meaning the same or slightly more capital is being distributed across far fewer companies.
Which digital health clusters are leading the shift toward maturity?
Health Management Solutions and Medical Diagnostics show the strongest partnership intensity relative to capital raised, suggesting broad-based enterprise adoption. Research Solutions leads on total funding, but that total is concentrated in a small number of large AI-biology rounds rather than widespread deployment.
Why did enterprise partnership volume fall in H1 2026?
Part of the decline is consistent with a more selective, consolidating market. Part is likely a data-timing effect: partnership counts for April through June 2026 are visibly lower than January through March, a pattern consistent with reporting lag. The final H1 2026 figure will likely revise upward, as it already has relative to Galen Growth’s initial H1 2026 update published in early July 2026.
What should investors and pharma innovation leads do differently now?
Investors should weight evidence and adoption as heavily as growth metrics, and treat ventures with high partnership activity but weak evidence as higher-risk than the partnership count alone would suggest. Pharma and corporate innovation teams should structure partnerships for resilience, governance and data rights, not just innovation optics.
Data source and methodology
Data source: HealthTech Alpha by Galen Growth, accessed July 2026, covering venture financing, partnership activity, company profiles and market positioning across the global digital health ecosystem for H1 2022 through H1 2026. Funding figures are reported in US dollars; deal and partnership counts reflect transactions disclosed and classified as of the access date.
Related Galen Growth analysis
- Digital Health Exits 2026: M&A & IPO Market Report
- Health Management Solutions in Digital Health, 2026
- Global Digital Health Funding: Key Trends 2025
Disclaimer
This analysis is provided solely for informational purposes and was prepared in good faith on the basis of public information available at the time of publication without independent verification. Numbers will be updated from time to time to reflect information identified after the event. Galen Growth does not guarantee or warrant the reliability or completeness of the data nor its usefulness in achieving any particular purposes. Galen Growth shall not be liable for any loss, damage, cost or expense incurred by any reason because of any person’s use or reliance on this report.
How to cite this analysis
About Galen Growth
Galen Growth is the Healthcare Innovation Intelligence company behind HealthTech Alpha. Built on proprietary data, AI-enabled workflows and expert insights, HealthTech Alpha delivers decision-grade intelligence that helps healthcare leaders identify opportunities, evaluate companies and make better strategic decisions.