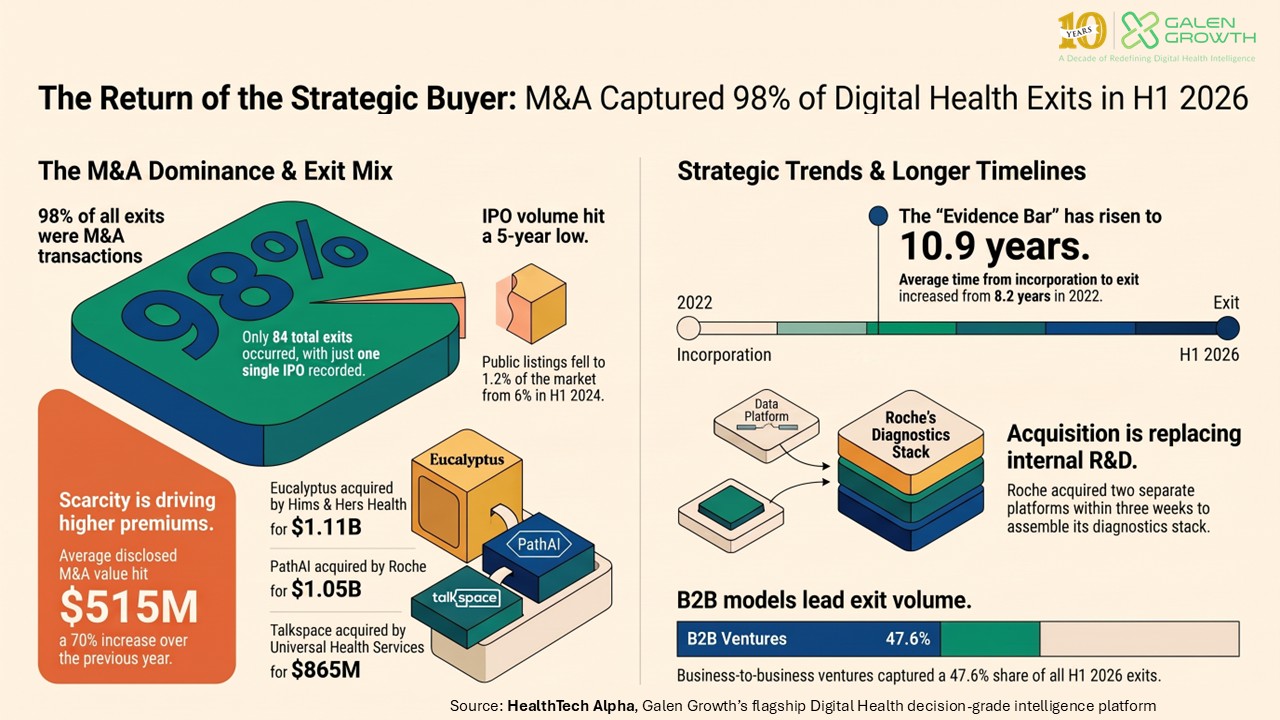
Strategic acquirers have taken control of digital health liquidity: M&A captured 97.6% of exit volume in H1 2026, the highest share on record, while the IPO route has narrowed to a single listing.
KEY TAKEAWAYS
- Liquidity has been re-routed, not restored. M&A accounted for 97.6% of H1 2026 exits (82 of 84) — the highest share of the past five H1 periods — while IPO volume fell to a single listing, Generate Biomedicines, at $400M. Investors underwriting a public-market outcome are underwriting an increasingly narrow path.
- Scarcity is being priced as premium, not discount. M&A count fell to 82 transactions, the lowest of the five-year window, yet disclosed deal value reached $5.15B across just 10 disclosed transactions — an average disclosed value of roughly $515M, the highest of any H1 since 2022.
- Diagnostics M&A is a European story, not a North American one. Seven of the 11 Medical Diagnostics acquisitions in H1 2026 involved European-headquartered ventures — the only top-5 cluster where Europe, not North America, led.
- Roche’s diagnostics buy-list is the clearest evidence that acquisition has replaced internal build. Its purchases of PathAI ($1.05B) and SAGA Diagnostics ($595M) three weeks apart signal platform assembly by deal, not by R&D cycle — a pattern corporates should expect competitors to replicate.
- The evidence bar has risen structurally, not cyclically. Average time from incorporation to M&A exit has climbed from 8.2 years in H1 2022 to 10.9 years in H1 2026. Capital structures and reserve planning should treat a decade-long path as the base case.
Exits are back — on strategic acquirers’ terms
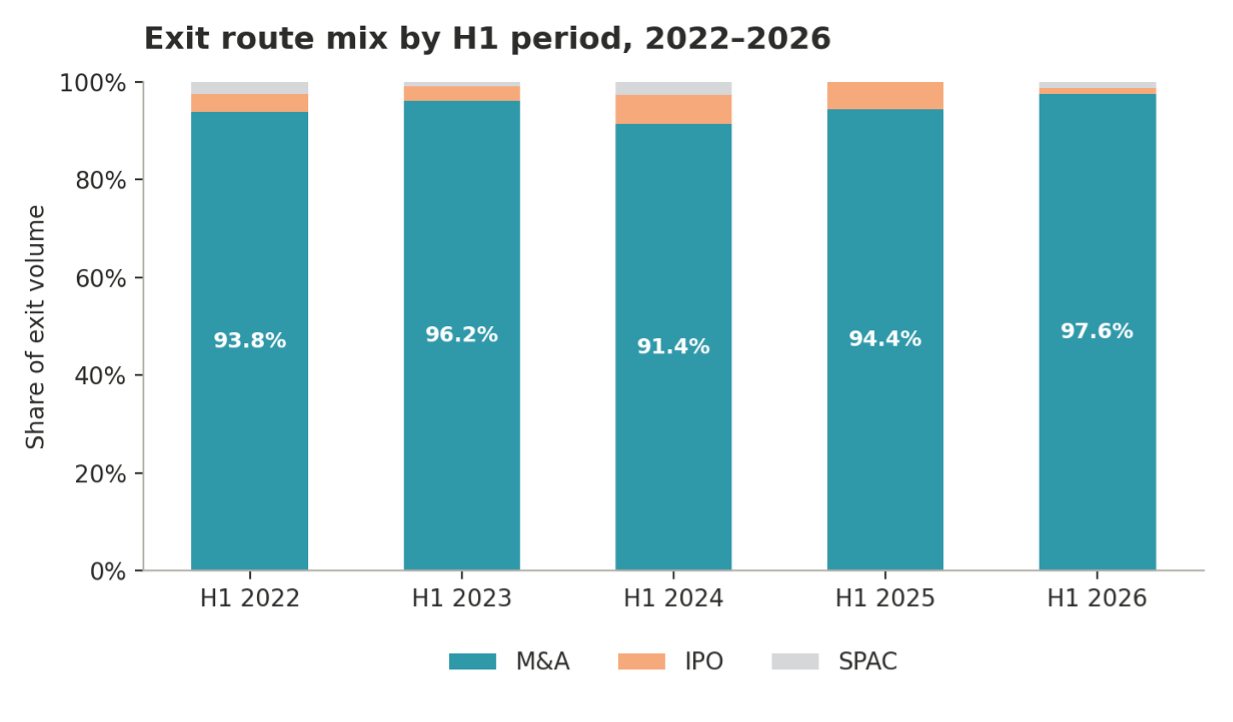
Digital health recorded 84 exits in H1 2026: 82 acquisitions, one IPO, and one SPAC. The resulting 97.6% M&A share is the highest of the past five H1 periods, sitting alongside the lowest IPO share of the same window — 1.2%, against 5.6% in H1 2025 and 6.0% in H1 2024.
For investors and corporates, the strategic read is direct: the exit market has not reopened in the sense of restoring optionality. It has consolidated around a single, buyer-controlled channel. Underwriting a public-market outcome for a digital health portfolio company is now underwriting an outlier, not a base case.
Fewer deals, higher conviction
Total M&A count fell to 82 transactions in H1 2026 — the lowest headcount of the five-year window, down from 118 in H1 2025. Buyers were not retreating; they were being selective. Disclosed M&A value reached $5.15B across just 10 disclosed transactions, an average disclosed deal value of roughly $515M — more than 70% above H1 2025’s disclosed average and the highest of any H1 since 2022.
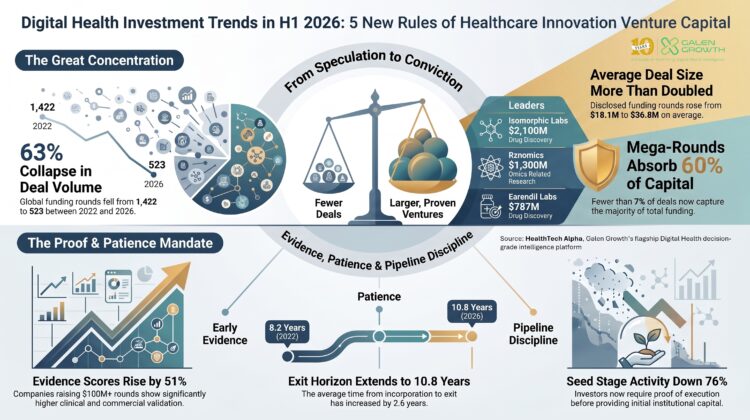
The same discipline is visible in primary funding, which excludes M&A, IPO, SPAC, and post-IPO rounds throughout this analysis. Deal count fell to 525 in H1 2026 from 1,419 in H1 2022 — a 63% contraction — while average deal size rose to $31.7M, roughly double the $16.6M average of H1 2022 and up 71% year-on-year from H1 2025’s $18.6M. Capital and control are concentrating in parallel: investors are backing fewer companies with larger cheques, and acquirers are buying fewer companies at higher conviction prices.
The five largest disclosed acquisitions of H1 2026:
| Venture | Acquirer | Disclosed value | Strategic rationale |
| Eucalyptus (Australia) | Hims & Hers Health | $1.11B | Channel expansion — Australia, Japan, Europe telehealth distribution |
| PathAI (US) | Roche | $1.05B | Capability buy — AI-powered pathology and diagnostics |
| Talkspace (US) | Universal Health Services | $865M | Consolidation — behavioural health capacity |
| SAGA Diagnostics (Sweden) | Roche | $595M | Vertical integration — omics-based diagnostics |
| Noctrix Health (US) | ResMed | $340M | Product-line expansion — wearable neurostimulation for RLS |
Where the capital concentrated: cluster, region and business model
Acquisition activity in H1 2026 clustered around workflow and infrastructure categories rather than single-feature consumer products. Health Management Solutions led with 22 of the 82 M&A transactions, followed by Medical Diagnostics (11), Patient Solutions (10), Wellness (9), and Telemedicine (6). The regional composition beneath those clusters is where the strategic signal sharpens.
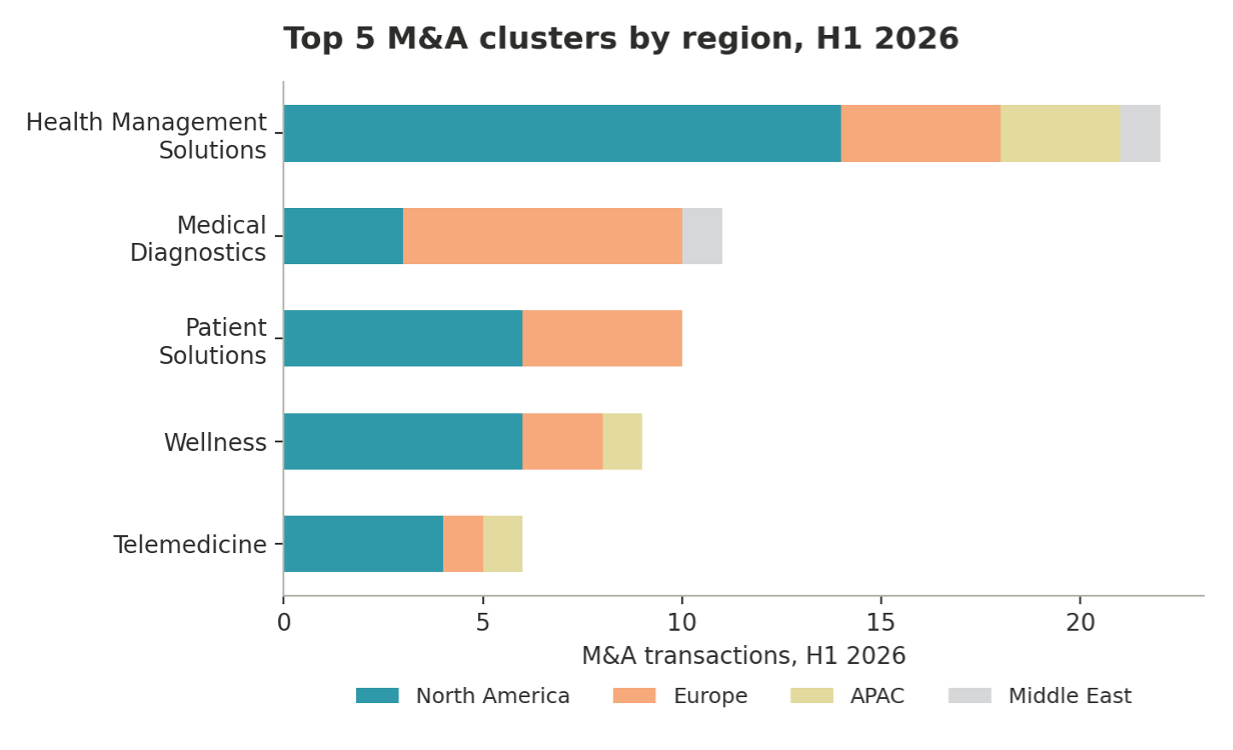
For corporates building a diagnostics acquisition pipeline, this is an actionable finding: Europe currently offers deeper target density than the broader digital health market composition would suggest, while every other leading cluster remains North America-led.
Business-model composition has also shifted, though not in a straight line. B2B ventures made up 47.6% of H1 2026 M&A exits, against 31.7% for B2C and 17.1% for B2B2P — a marked step up from B2B’s 36.9% share in H1 2022. That shift did not climb steadily: B2B share peaked at 53.0% in H1 2023, eased to 46.2% in H1 2024, rose again to 51.7% in H1 2025, and settled at 47.6% in H1 2026. The consistent element is not a straight-line trend but a step-change around 2023 — B2B has held a 46–53% band in every H1 since, against a 36.9% baseline beforehand. Consumer-facing ventures still exit at scale, as Eucalyptus and Noctrix Health show, but the sustained post-2023 elevation points to strategic buyers structurally favouring workflow-embedded assets over consumer reach alone. For a fuller breakdown of business-model and funding composition, see Galen Growth’s The Maturity Era: Digital Health Funding, H1 2026.
The evidence bar: exits are taking longer to earn
Average time from incorporation to M&A exit has lengthened in every H1 period bar one since 2022 — from 8.2 years to 10.9 years in H1 2026. This is not a temporary air pocket; it is a structural recalibration of how much operating and clinical evidence a strategic acquirer now requires before committing capital.
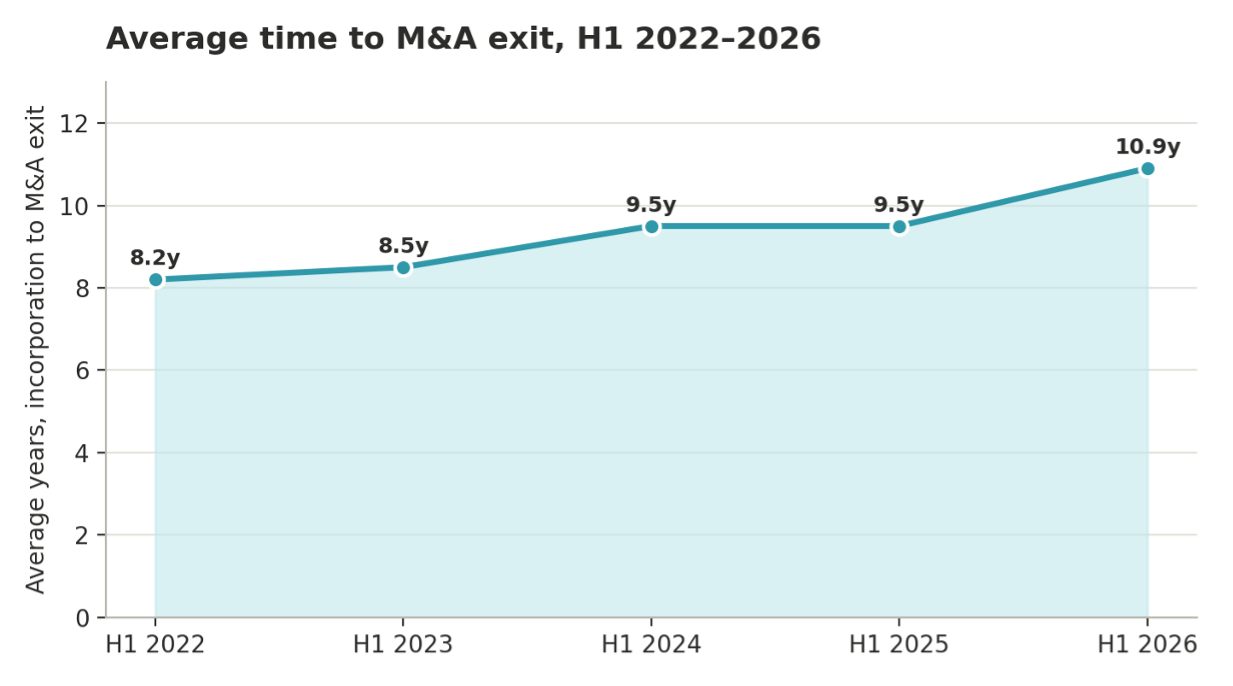
For investors, this changes the underwriting model directly: capital structures and reserve planning should assume a decade-long path to M&A as the base case. For ventures, it reframes runway discipline as an acquisition prerequisite rather than a defensive measure.
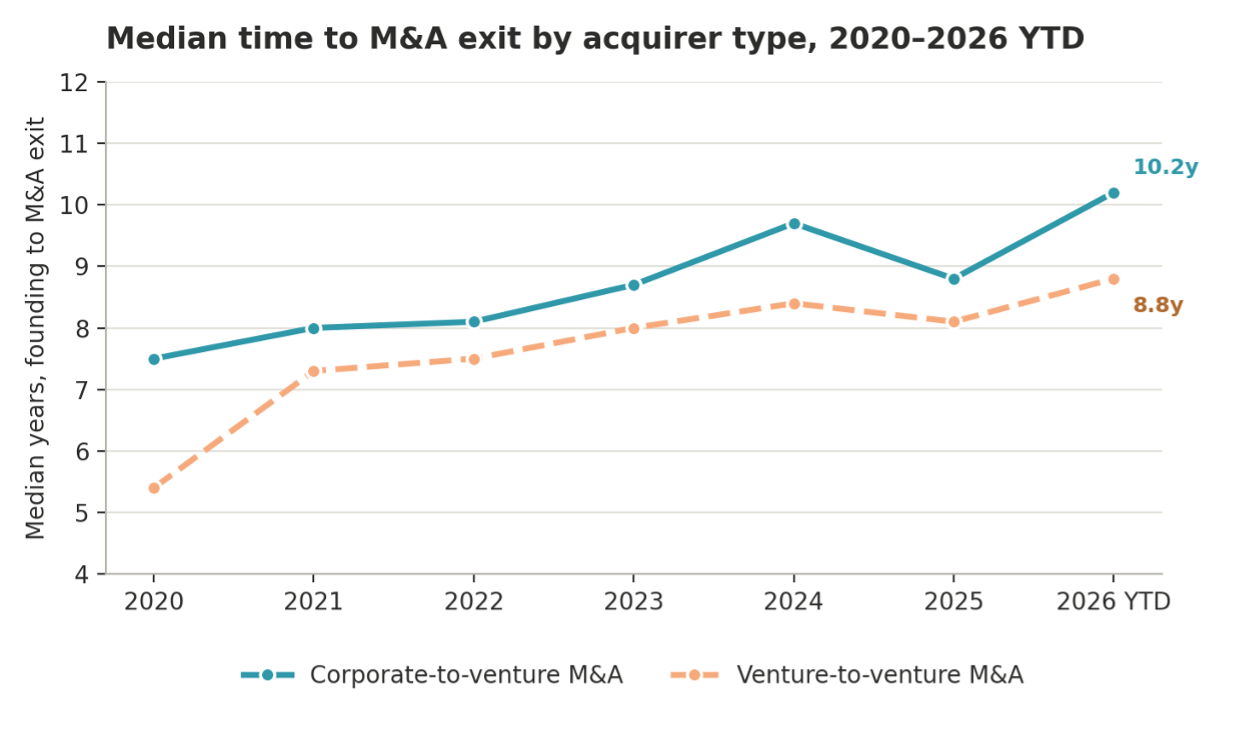
That longer path differs by buyer type, but the trend remains the same. Corporate acquirers consistently buy more mature companies than venture-to-venture acquirers do — and the gap has held in every year since 2020, even as both timelines have risen. In 2026 YTD, ventures acquired by a corporate reached a median of 10.2 years from founding before exit, against 8.8 years for ventures acquired by another venture-backed company.
Detailed analysis can be found in Galen Growth’s June 2026 report: Exits are Back. Easy Exits Aren’t. Digital Health 2026.
Strategic buyers are assembling platforms through acquisition, not R&D
The Roche pattern is the sharpest evidence in H1 2026 that acquisition has substituted for internal development. Roche acquired SAGA Diagnostics on 16 April and PathAI on 7 May — three weeks apart, for a combined $1.645B. The sequencing gives Roche an omics-diagnostics platform and an AI-pathology layer within a single quarter, compressing what would otherwise be a multi-year internal build into two transactions.
Roche is not an isolated case. OpenAI’s acquisition of Torch for approximately $60M is small by value but material by direction: a technology-native platform entrant, without a prior healthcare M&A track record, choosing to acquire clinical-memory infrastructure rather than build the equivalent internally. Health platform acquirer Function Health made two H1 2026 bolt-ons — Getlabs and SuppCo — extending its diagnostics stack deal by deal.
For investors and corporates, the strategic implication is symmetric: acquisition now offers the fastest route to a target capability, and that speed advantage is available to competitors and adjacent-industry entrants in equal measure.
What this means
For investors: Model M&A as the base-case exit for the substantial majority of digital health holdings, and underwrite a decade-long path to liquidity rather than a seven-to-eight-year assumption. Reserve capital planning should reflect the 10.9-year H1 2026 average, and portfolio construction should weight enterprise-relevant assets, which have held a 46–53% share of M&A exit volume in every H1 since 2023.
For corporates: Expect competitors and adjacent-industry entrants to acquire capability rather than build it — Roche’s sequential diagnostics purchases and OpenAI’s entry via Torch both demonstrate acquisition cycles measured in weeks, not years. Build an explicit strategic-buyer map and act on it early, particularly in the higher-density European diagnostics market.
For digital health ventures: Plan around a longer runway to exit as the default, not the exception, and prioritise the specific enterprise or clinical capability a strategic buyer would value — B2B and workflow-embedded models have structurally outperformed consumer-facing peers in capturing exit volume since 2023. IPO remains a realistic outcome for only a small number of category leaders with substantial revenue scale.
Frequently asked questions
Is the digital health IPO market reopening in 2026?
Not on the H1 evidence. Digital health recorded only one IPO in H1 2026 — Generate Biomedicines at $400M — down from seven in each of H1 2024 and H1 2025, the weakest H1 for IPO volume in the five-year window covered here.
Why is M&A so dominant in digital health exits right now?
Strategic acquirers can value specific capabilities — diagnostics platforms, clinical workflows, distribution channels — directly, even where public-market appetite for digital health listings remains narrow. In H1 2026 that dynamic pushed M&A’s share of total exit volume to 97.6%, the highest of the past five H1 periods.
What does Roche’s double acquisition of PathAI and SAGA Diagnostics show?
It shows a strategic buyer assembling a diagnostics and AI-pathology platform through sequential acquisition rather than a single internal development programme — the two deals, worth a combined $1.645B, closed three weeks apart in April and May 2026.
Why are digital health exits taking longer to happen?
Buyers are demanding more operating, clinical, and commercial evidence before committing. Average time from incorporation to M&A exit has risen from 8.2 years in H1 2022 to 10.9 years in H1 2026.
What should corporates do differently in this market?
Build an explicit strategic-buyer map and move early: with average disclosed deal value up more than 70% year-on-year and total M&A count at a five-year low, target scarcity favours acquirers who commit before a company reaches IPO-scale evidence.
Data source and methodology
Data source: HealthTech Alpha, accessed July 2026, covering exit volume and route mix (M&A, IPO, SPAC), disclosed and undisclosed deal value, cluster-by-region distribution, business-model composition of M&A exits, primary funding volume, and time from incorporation to M&A exit, restricted to the H1 period (January–June) of each year from 2022 to 2026.
This analysis is provided solely for informational purposes and was prepared in good faith on the basis of public information available at the time of publication without independent verification. Numbers will be updated from time to time to reflect information identified after the event. Galen Growth does not guarantee or warrant the reliability or completeness of the data nor its usefulness in achieving any particular purposes. Galen Growth shall not be liable for any loss, damage, cost or expense incurred by any reason because of any person’s use or reliance on this report.
Related Galen Growth analysis
- The Maturity Era: Digital Health Funding, H1 2026 (Galen Growth blog)
- Exits are Back. Easy Exits Aren’t. Digital Health 2026 (Galen Growth report, June 2026)
- 95% of Digital Health Exits Are Now M&A: 2026 Liquidity Shift (Galen Growth blog)
How to cite this analysis
About Galen Growth
Galen Growth is the Healthcare Innovation Intelligence company behind HealthTech Alpha. Built on proprietary data, AI-enabled workflows and expert insights, HealthTech Alpha delivers decision-grade intelligence that helps healthcare leaders identify opportunities, evaluate companies and make better strategic decisions.