
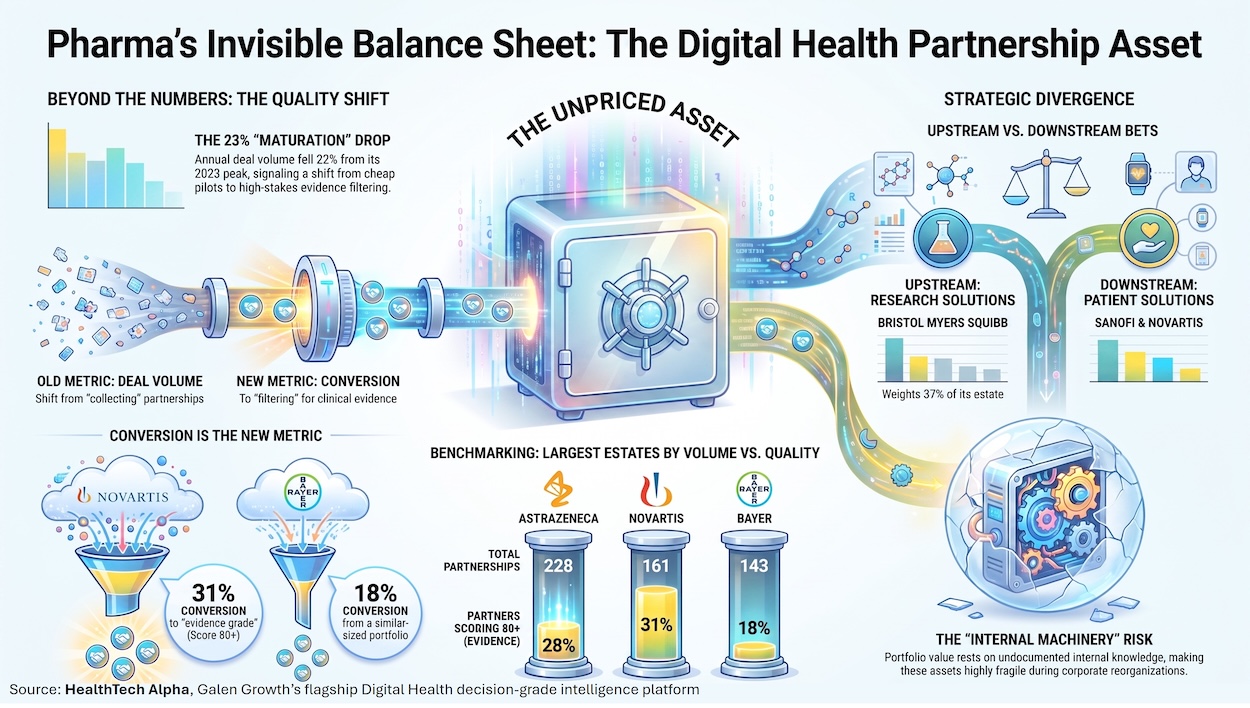
The thirteen largest pharmaceutical Digital Health portfolios hold 1,707 recorded Digital Health relationships — capabilities, data access and talent that would take years to rebuild internally. They appear in no financial statement, and almost no investor prices them.
KEY TAKEAWAYS
- Pharma has built a second asset base that appears on no balance sheet: 1,707 Digital Health partnerships across the thirteen largest portfolios, holding capabilities and data access that would take years and considerable capital to rebuild internally.
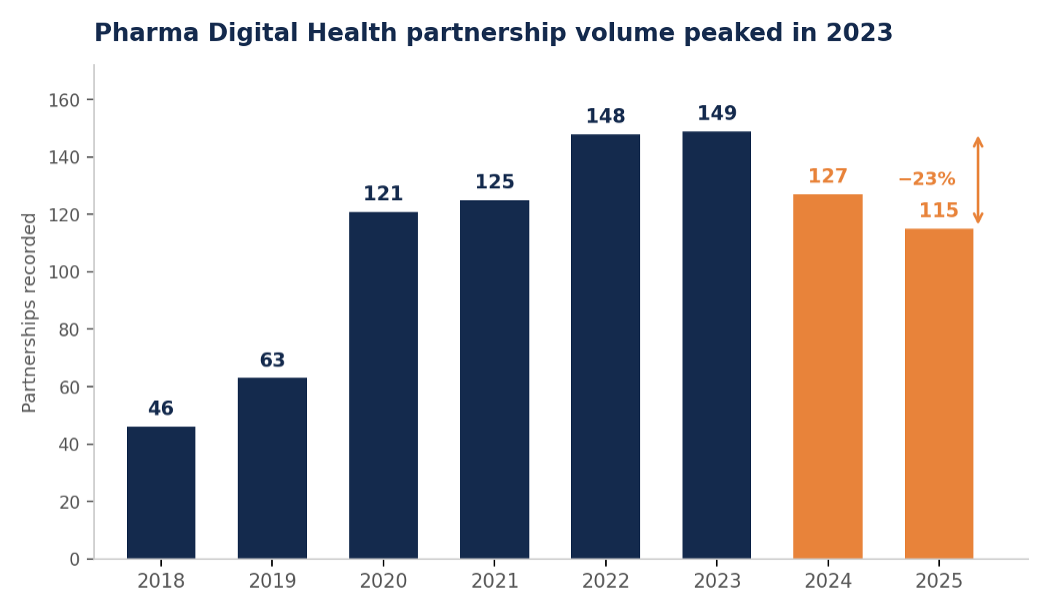
- The accumulation phase is over: buyers are now filtering rather than collecting, with volume down 23% from its 2023 peak of 149 deals to 115 in 2025. Ventures selling a pilot rather than evidence will feel this first.
- Each portfolio encodes a bet on where the bottleneck sits, and companies keep doubling down on the same one. Bristol Myers Squibb puts 37% of its portfolio into Research Solutions and most recently signed Chai Discovery; Sanofi and Novartis weight downstream into Patient Solutions.
- Where a company scouts determines which populations its tools are validated on. AstraZeneca is the only major portfolio whose largest regional cluster sits outside the West, with 79 partner ventures in APAC, while most recent deals across the peer group cluster in the US and western Europe.
- The asset that actually matters is the internal machinery that converts a partnership into a repeatable operating decision — and it is the first thing lost in a reorganisation, which makes these portfolios most fragile at exactly the moment they are being rationalised.
Pharma has quietly built a second balance sheet
Ask a pharmaceutical executive what the company owns and the answer arrives in a familiar order: molecules, patents, manufacturing, a commercial footprint, a pipeline of candidates at various phases. All of it is disclosed, audited and modelled to two decimal places.
Now ask which external ventures supply the company's molecular profiling, its imaging triage, its trial recruitment, its patient-support layer and its target-identification models. The answer is usually vaguer, held across several functions, and appears in no financial statement. Yet HealthTech Alpha records 1,707 such relationships across the thirteen largest pharmaceutical Digital Health portfolios — capability roughly the size of a mid-tier venture fund's entire holdings, assembled almost entirely off balance sheet.
This is the part of the industry that has changed fastest and is measured least. Discovery now runs on computational biology, omics and high-content screening. Development runs on data infrastructure, site selection, patient matching, digital endpoints and remote monitoring. Commercial performance depends on identifying the right patient, removing access friction and supporting treatment beyond the prescription. The medicine remains the product. It is no longer the whole advantage.
The brief market panic last month over a rumoured AstraZeneca–Bristol Myers Squibb combination — denied within 48 hours — was instructive only for what it revealed about analytical habit. Every question asked was about molecules, patent cliffs and divestitures. None was about which of the two companies had built the better system for turning outside science into internal decisions. That is the question the data can now answer.
Why has pharma Digital Health partnership volume fallen since 2023?
These portfolios were not built steadily. In 2018 the thirteen companies recorded 46 Digital Health partnerships between them. By 2020 that had risen to 121, and by 2022 and 2023 they were signing roughly 150 a year. Then the line turned: 127 in 2024, 115 in 2025 — a 23% fall from the peak across two consecutive years.
A falling line invites the obvious reading: pharma is cooling on Digital Health. We think that reading is wrong, and the rest of the data is the reason why.
Volume was never a measure of appetite. It was a measure of how cheap it had become to start something. Between 2020 and 2023, a pharmaceutical company demonstrated seriousness about Digital Health by signing partnerships, and the marginal cost of one more pilot — a memorandum, a small budget line, a slide at the innovation day — was close to nothing. Under those conditions the count rises whether or not anything is working.
What changed is the cost of continuing. A pilot that has run for three years without altering a development decision is now a line item somebody has to defend, and the people who signed the original memorandum have often moved on. The demonstration was always the easy part. Producing evidence that the demonstration mattered is the part that ends careers, and it is where a large share of these 1,707 relationships are currently stuck.
So the decline is better read as a filter than as a retreat. Fewer, more deliberate partnerships is what a maturing market looks like — the same pattern visible in corporate venturing, in cloud procurement and in every technology category that has passed through an enthusiasm phase. This is a judgement, not a finding; the chart alone cannot distinguish consolidation from cooling. But the cross-sectional data supports it, because it shows that the companies signing the most were never the companies partnering the best.
A bigger portfolio is not a better one
The most useful test available in the data is evidence quality — the proportion of a company's partner ventures that reach a HealthTech Alpha Evidence Score of 80 or above, meaning substantive clinical, regulatory or peer-reviewed validation rather than a demonstration and a press release.
On that measure the ranking scrambles completely. Novartis leads at 31%, from the fourth-largest portfolio. Takeda and GSK follow at 30% and 29% from portfolios of 80 and 79 relationships respectively. AstraZeneca, with three times the volume, converts 28%. Bayer, with 143 partnerships, manages 18% — the lowest in the peer group and a full 13 points behind Novartis.
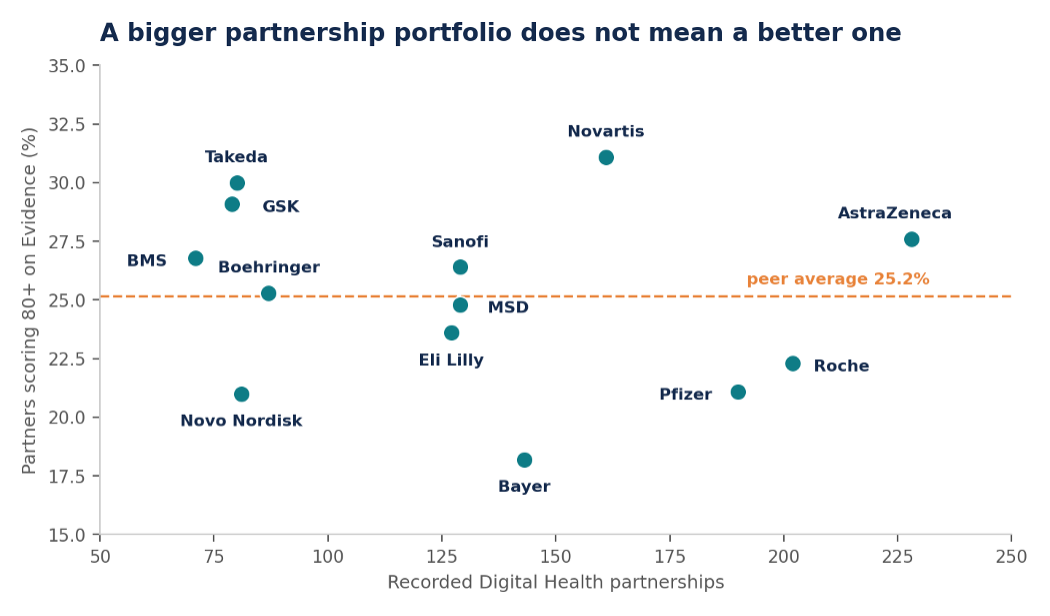
The pattern holds at the smaller end too. Novo Nordisk and Boehringer Ingelheim run portfolios of similar scale — 81 and 87 partnerships — but convert 21% and 25% respectively, a gap as wide as anything among the giants.
The three largest portfolios — AstraZeneca, Roche and Pfizer — cluster at or below the peer average of 25%. This is what accumulation without curation looks like at scale. It is not evidence that breadth is a mistake; a global scouting network buys optionality and early sight of methods that have not yet reached the literature. It is evidence that breadth and quality are separate management problems, and that only one of them is visible from a partnership count.
For anyone benchmarking a pharmaceutical company's external innovation position, this is the single most important correction to make. Announcing 200 partnerships is a communications outcome. Converting a quarter of them into evidence-generating relationships is an operating outcome. The two are routinely confused, including by the companies themselves.
Every major portfolio is a bet on a different part of the value chain
The cluster mix reveals strategy more honestly than any innovation-day presentation. Across the top ten portfolios, Research Solutions is the largest single concentration at 282 partnerships, followed by Patient Solutions at 260, Medical Diagnostics at 234, Health Management Solutions at 190 and Clinical Trials at 113.
Aggregate figures hide the divergence, though. Bristol Myers Squibb commits 37% of its portfolio to Research Solutions and just 7% to Patient Solutions — a portfolio built almost entirely upstream, around computational discovery and the science it understands best. Eli Lilly is similarly research-weighted at 31%. AstraZeneca inverts the emphasis, with 27% in Medical Diagnostics, the largest diagnostics concentration in the peer group at 61 relationships. Sanofi and Novartis lean furthest downstream, at 23% and 20% in Patient Solutions respectively.
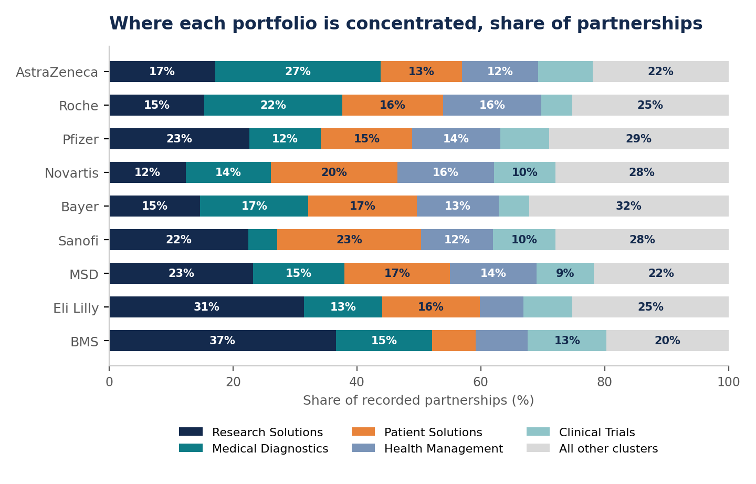
These are genuinely different theories of where advantage sits. An upstream-weighted portfolio assumes the bottleneck is target selection and molecular design — that the scarce resource is scientific insight. A downstream-weighted portfolio assumes the bottleneck is identification, access and adherence — that the science is adequate and the delivery is not. Both can be right in different therapeutic areas. Neither is visible in a pipeline chart.
Geography reflects the same divergence. AstraZeneca is the only major portfolio whose largest regional cluster sits outside the West: 79 partner ventures in APAC against 76 in Europe and 67 in North America. Eli Lilly and MSD run the opposite configuration, with 79 and 70 North American ventures respectively against far thinner European exposure. Bristol Myers Squibb is the most concentrated of all, with just seven APAC partner ventures out of 71. Where a company scouts determines which scientific communities and which patient populations shape its tools.
| Company | Partnerships | Avg Evidence Score | Partners scoring 80+ | North America | Europe | APAC |
| AstraZeneca | 228 | 50.5 | 28% | 29% | 33% | 35% |
| Roche | 202 | 45.6 | 22% | 33% | 34% | 27% |
| Pfizer | 190 | 42.1 | 21% | 47% | 28% | 21% |
| Novartis | 161 | 46.9 | 31% | 38% | 30% | 29% |
| Bayer | 143 | 42.1 | 18% | 41% | 29% | 28% |
| Sanofi | 129 | 48.9 | 26% | 44% | 26% | 25% |
| MSD | 129 | 46.7 | 25% | 54% | 19% | 24% |
| Eli Lilly | 127 | 52.6 | 24% | 62% | 17% | 20% |
| Bristol-Myers Squibb | 71 | 51.0 | 27% | 62% | 27% | 10% |
The most recent deal on each company's record is a useful tell, because it shows where the money is going now rather than where it went five years ago. Bristol Myers Squibb's latest is Chai Discovery, an AI protein-interaction company — upstream, computational, and consistent with a portfolio already 37% weighted to Research Solutions. Bayer's most recent is Iambic Therapeutics and MSD's is Turbine, both also in drug discovery. AstraZeneca went to Helix, a population genomics company carrying an Evidence Score of 90.8, among the highest in any of these portfolios.
The downstream bets look nothing like these. Eli Lilly's most recent partner is Oura, the Finnish wearables company, and Pfizer's is Bluesight, which works on hospital medication tracking rather than anything resembling discovery. Roche went to Doctolib in France and Sanofi to DiappyMed, a clinically validated insulin-dosing app. Novartis signed Yidu Cloud in China — the only recent deal in this set outside the US and western Europe, and a reminder that APAC scouting remains thin almost everywhere except AstraZeneca.
| Company | Most recent partner | Date | Focus | Partner HQ |
| Bristol Myers Squibb | Chai Discovery | Aug 2026 | Drug discovery | United States |
| Pfizer | Bluesight | Jul 2026 | Healthcare operations | United States |
| Novartis | Yidu Cloud | Jul 2026 | Clinical data infrastructure | China |
| Eli Lilly | Oura | Jul 2026 | Wearables | Finland |
| AstraZeneca | Helix | Jul 2026 | Omics research | United States |
| Bayer | Iambic Therapeutics | Jun 2026 | Drug discovery | United States |
| Roche | Doctolib | Apr 2026 | Medical concierge | France |
| Sanofi | DiappyMed | Mar 2026 | Disease management | France |
| MSD | Turbine | Aug 2025 | Drug discovery | United Kingdom |
One caution on reading recency as quality. Chai Discovery carries a Maturity Score of 73.1 but an Evidence Score of just 10.3 — a well-funded, technically credible company that has not yet produced published validation. Helix and Iambic Therapeutics, at 90.8 and 82.2, are the opposite case. Both kinds of bet belong in a portfolio, but only one of them is currently defensible to a board asking what the partnership proved.
The risk is not that these assets are overvalued. It is that nobody owns them.
The obvious counter-argument is that partnership portfolios are soft assets dressed up as hard ones. A memorandum of understanding is not a licence. Many of these 1,707 relationships will have lapsed quietly without ever being formally terminated.
That objection is fair, and it is why evidence quality matters more than count. But the deeper problem is structural. The value of a Digital Health partnership rests on a few people who understand the scientific problem, the venture's technology and the internal route to adoption — knowledge that is rarely documented. Reassign the sponsor or hand the relationship to central procurement, and the asset does not fail dramatically. It decays.
This is why the falling deal count deserves attention. A consolidating portfolio attracts rationalisers, and rationalisation reviews reward the largest vendor and the easiest integration. Some pruning is overdue. But early-stage science benefits from parallel paths precisely because nobody knows which approach will work.
Investors have been slow to price any of this. A company with 200 curated external relationships holds capabilities, data access and technical talent that would take years and considerable capital to rebuild internally — and the Evidence Score spread shows that portfolio has a measurable quality distribution.
So the questions have changed. Which partners are embedded in core R&D workflows rather than innovation-lab showcases? What share of the portfolio has generated clinical evidence? What happened to the portfolio at the last restructuring? And who, by name, is accountable for turning an experiment into an operating capability?
Thirteen companies have spent a decade assembling this system in public, one announcement at a time. The accumulation phase is over. The winners will not be those with the most partnerships or the busiest innovation days, but those who can turn outside innovation into repeatable internal decisions without crushing the speed and curiosity that made it worth buying.
What this means
For investors: Partnership portfolios belong in the analysis, not the appendix, and their size is close to useless as a proxy for their strength — Novartis converts 31% of its partners to Evidence Scores of 80+ against Bayer's 18%. Ask what share of a company's partners have generated clinical evidence, which relationships are embedded in core workflows, and what happened to the portfolio at the last restructuring.
For pharma and corporate partners: The scarce capability is no longer scouting; the peer group has already built the networks, and 1,707 relationships are now in place across thirteen companies. It is the internal machinery that converts a successful pilot into a repeatable operating decision — and the named individuals who hold that knowledge are the first casualties of any reorganisation.
For health systems and providers: Consolidation of these portfolios concentrates decisions about which diagnostics, trial platforms and monitoring tools reach patients. Regional concentration matters here: Bristol Myers Squibb holds just seven APAC partner ventures out of 71, and a portfolio scouted almost entirely in one geography will produce tools validated in one set of populations and care settings.
For digital health ventures: The generic innovation pitch is finished. With deal volume down 23% from its 2023 peak and buyers rebuilding internal technical capacity, evidence quality and demonstrable fit to a specific bottleneck now determine which ventures survive the consolidation — and a more technically literate buyer should be welcomed by the strongest of them.
FREQUENTLY ASKED QUESTIONS
Which pharmaceutical companies have the largest Digital Health partnership portfolios?
AstraZeneca leads with 228 recorded Digital Health partnerships, followed by Roche (202), Pfizer (190), Novartis (161) and Bayer (143), according to HealthTech Alpha by Galen Growth. The thirteen largest pharmaceutical portfolios together account for 1,707 recorded relationships.
Is pharmaceutical Digital Health partnership activity still growing?
No. Recorded deal volume across these thirteen companies peaked at 149 partnerships in 2023 and has fallen in each of the two years since, to 127 in 2024 and 115 in 2025 — a 23% decline. Our reading is that this reflects the end of a cheap-pilot phase rather than a loss of strategic commitment.
Does a larger partnership portfolio indicate a stronger one?
The data suggests not. Novartis converts 31% of its partner ventures into Evidence Scores of 80 or above from the fourth-largest portfolio, while Bayer reaches 18% from a portfolio of similar scale. The three largest portfolios all sit at or below the peer average of 25%.
Which parts of the value chain are these portfolios concentrated in?
Across the top ten portfolios, Research Solutions is the largest single concentration at 282 partnerships, followed by Patient Solutions (260), Medical Diagnostics (234), Health Management Solutions (190) and Clinical Trials (113). Bristol Myers Squibb commits 37% of its portfolio to Research Solutions; Sanofi and Novartis weight furthest downstream.
What are the most recent pharma Digital Health partnerships?
The most recent recorded deals include Bristol Myers Squibb with Chai Discovery (August 2026), Pfizer with Bluesight and Novartis with Yidu Cloud (both July 2026), Eli Lilly with Oura, AstraZeneca with Helix, and Bayer with Iambic Therapeutics (June 2026). The split holds: discovery-weighted companies keep buying discovery, patient-weighted companies keep buying the patient layer.
Why are pharma partnership portfolios difficult to value?
They appear in no financial statement, span several internal functions, and depend heavily on individual relationships that are rarely documented. Their value rests on a small group of people who understand the scientific problem, the venture's technology and the internal path to adoption — which is also why they are unusually vulnerable to reorganisation and procurement-led review.
Methodology and data source
Data source: HealthTech Alpha by Galen Growth, Q3 2026 (covering partnership records to August 2026), across the thirteen largest pharmaceutical partnership portfolios: AstraZeneca, Roche, Pfizer, Novartis, Bayer, Sanofi, MSD, Eli Lilly, Boehringer Ingelheim, Novo Nordisk, Takeda, GSK and Bristol Myers Squibb. Partnership records reflect relationships captured in the database and may include undated entries, repeated relationships and partnerships whose current status has not been publicly updated; counts should be read as indicative of portfolio shape rather than as an exhaustive census. Annual deal-volume figures cover only records carrying a partnership date, so totals by year do not sum to full portfolio counts, and because recent partnerships are the most likely to be incompletely captured, some portion of the 2024–2025 decline may reflect reporting lag rather than reduced activity. Regional splits use venture headquarters location. Cluster concentration figures use each venture's assigned primary cluster.
This analysis is provided solely for informational purposes and was prepared in good faith on the basis of public information available at the time of publication without independent verification. Numbers will be updated from to time to reflect information identified after the event. Galen Growth does not guarantee or warrant the reliability or completeness of the data nor its usefulness in achieving any particular purposes. Galen Growth shall not be liable for any loss, damage, cost or expense incurred by any reason because of any person's use or reliance on this report.
Related Galen Growth analysis
- Pharmaceutical Digital Health Innovation Index, 5th Edition — Galen Growth
- H1 2026: Digital Health Partnerships vs Funding — Galen Growth
- Digital Health H1 2026: The Maturity Era — Galen Growth
How to cite this analysis
About Galen Growth
Galen Growth is the digital health intelligence firm behind HealthTech Alpha, the leading ontology-driven platform tracking the global digital health ecosystem. With operating entities in the US, Europe and Asia, we combine large-scale labelled data, auditable GenAI research and explainable analytics to advise pharma, medical device, insurance, health system, investor and startup clients.